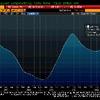


Case-Shiller Home Price Index (Photo credit: planspark)
Just in the last two days I have heard reported on the national news that prices have stabilized (link to the NAR release here) and that prices were declining in 16 of the 20 top metro areas (Case-Shiller link here).
How can these two stories be squared?
Honestly, I don’t think that they can be… and given experience with past “interpretations” by the NAR, I’m inclined to not believe the NAR numbers. Actually… I believe the numbers, but not the interpretation.
Case-Shiller looks at actual properties in some of their surveys. Rather than looking at averages or medians, they sample properties. By looking at repeat sales of the same address, they can better determine what prices are doing.
Pretty much every other study looks at all of the sales and then breaks it down to average or median prices. The problem then is that if more expensive homes are selling, it looks like values are going up. If less expensive homes are selling, it looks like prices are going down.
Of course, nothing is perfect.
The problem is that there are a LOT of ways that data can be sliced and diced. And EVERYONE that looks at the data has an agenda. Some may be better at ignoring their personal bias, but it is still there.
My take? I don’t think we are quite ready to recover. Yet. I think that the bottom line is that until there is a recovery in jobs (not the unemployment rate, but the employment rate), there will be no recovery in the hosing market. And that shakes out to local areas…
Related articles