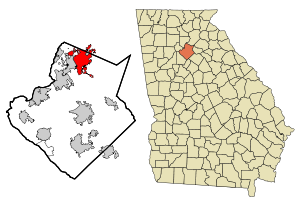
Market stats for Buford, GA, October, 2012 indicate that there were 336 properties on the market, a reduction of 28. Overall, there was about an 4.5 month supply of properties (Absorption Rate or A/R). There were 76 sales for October, up from 67 last month but slightly down from the 77 sales last Oct11. It isn’t the strongest market in Gwinnett, but the A/R is nothing to sneeze at. It is solidly in Seller’s Market territory.
In the sub-$200k arena, there were 162 listings, with a 3.2 month supply. This is the largest price segment in this market area, so strength here usually equals strength across the whole local market area. Sales were up from last month 58 (v 47 last month), and compared to last year (51 sales in Oct11). But, the A/R is WAY under the 6 months that would be considered fairly balanced… pointing towards a solid seller’s market.
Between $200k and $400k, there were 135 listings for sale, and about 6.9 months of supply. The 14 sales recorded were flat from the 14 last month and from the 18 sales last year for October. This had been one of the weaker segments in the county, but had improved dramatically and at current A/Rs, it is fairly balanced, though slightly tilted towards buyers..
From $400k to $600k, there were 18 homes on the market. The absorption rate is 7.7 Months. There have been 7 sales in the last 3 months (0 for August, 4 for September and 3 for October). When the market is rolling, there should be 5-7 sales a month during this part of the year. Just for comparison, there were 11 sales in the Aug-Oct period in 2011. This segment has been bouncing all over the place… but it is VERY strong right now.
In the $600k to $800k arena, there were 8 listings. Absorption Rate is 36+ months… but it jumps around a lot. Sales in this range are pretty sporadic, but steady when looking at the long-term. The drop in inventory over the last few months from 14 homes to 8 has made things look less slow… but there were 7 sales in this segment last year including 3 sales in March, 1 in June and 0 in October.
The range from $800k to $1m, there were 3 homes listed. Trends are hardly definable. Listings are down. June recorded the first sales since December, 2012. There were 0 sale in October. But it still has a 9.0 month Absorption Rate.
Above $1m, there were 10 properties listed. There was sale in the segment in April… of 2009…and then May, 2011… and 2 sales in June, 2011… also 1 in July and September. There was 1 sale in October. So, we have 15 months of inventory. I hope, but am not expecting, sales to be more consistent.
Buford, GA is a suburb of Atlanta in Gwinnett and Hall Counties. The population is 2000 was 10,668, but that only included the area inside the city limits, and it had seen tremendous growth since that census. Buford is home to Lake Lanier, one of Georgia’s premiere recreational areas, and Lake Lanier Islands. Recently, the City of Buford has revamped their old town. It is also home to Buford (Buford City Schools aren’t a part of Gwinnett County Schools), Mill Creek, Mountain View and Lanier High School (Lanier will open for the 2010-11 school year).
I have a page dedicated to Buford Market Data.
Related articles
- Buford, GA, Market Report, March 2012 (lanebailey.com)
- Buford, GA, Market Report, February 2012 (lanebailey.com)
- Buford, GA, Market Report, December 2011 (lanebailey.com)
- Buford, GA, Market Report, November 2011 (lanebailey.com)
- Buford, GA, Market Report, October 2011 (lanebailey.com)
- Buford, GA, Market Report, June 2011 (lanebailey.com)
- Buford, GA, Market Report, May 2011 (lanebailey.com)
- Buford, GA, Market Report, April 2011 (lanebailey.com)
- Buford, GA, Market Report, March 2011 (lanebailey.com)


