Not Found buford | Garage with a Detached Home | Gwinnett County GA

LaneBailey.com

Garage with a Detached Home

Contact Lane
  • Custom Listings

    Sign up to get notified when new listingscome on the market that meet your specs.

    Read More
  • Browse Listings

    Take a look at what is currently on the market in the areas that interest you.

    Read More
  • What's YOUR Home Worth?

    Get a free Maximum Price Analysis to find out the current market value of your home.

    Read More
  • 1

Category Archives: buford

Buford, GA, Market Report, October 2012

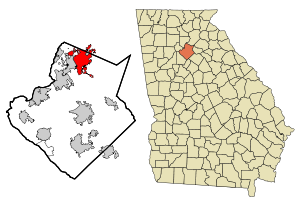
This map shows the incorporated and unincorpor...

Market stats for Buford, GA, October, 2012 indicate that there were 336 properties on the market, a reduction of 28.  Overall, there was about an 4.5 month supply of properties (Absorption Rate or A/R).  There were 76 sales for October, up from 67 last month but slightly down from the 77 sales last Oct11.  It isn’t the strongest market in Gwinnett, but the A/R is nothing to sneeze at.  It is solidly in Seller’s Market territory.

In the sub-$200k arena, there were 162 listings, with a 3.2 month supply.  This is the largest price segment in this market area, so strength here usually equals strength across the whole local market area.  Sales were up from last month 58 (v 47 last month), and compared to last year (51 sales in Oct11).  But, the A/R is WAY under the 6 months that would be considered fairly balanced… pointing towards a solid seller’s market.

Between $200k and $400k, there were 135 listings for sale, and about 6.9 months of supply.  The 14 sales recorded were flat from the 14 last month and from the 18 sales last year for October.  This had been one of the weaker segments in the county, but had improved dramatically and at current A/Rs, it is fairly balanced, though slightly tilted towards buyers..

From $400k to $600k, there were 18 homes on the market.  The absorption rate is 7.7 Months.  There have been 7 sales in the last 3 months (0 for August, 4 for September and 3 for October).  When the market is rolling, there should be 5-7 sales a month during this part of the year.  Just for comparison, there were 11 sales in the Aug-Oct period in 2011.  This segment has been bouncing all over the place… but it is VERY strong right now.

In the $600k to $800k arena, there were 8 listings.  Absorption Rate is 36+ months… but it jumps around a lot. Sales in this range are pretty sporadic, but steady when looking at the long-term. The drop in inventory over the last few months from 14 homes to 8 has made things look less slow… but there were 7 sales in this segment last year including 3 sales in March, 1 in June and 0 in October.

The range from $800k to $1m, there were 3 homes listed.  Trends are hardly definable.  Listings are down.  June recorded the first sales since December, 2012.  There were 0 sale in October.  But it still has a 9.0 month Absorption Rate.

Above $1m, there were 10 properties listed.  There was sale in the segment in April… of 2009…and then May, 2011… and 2 sales in June, 2011… also 1 in July and September.  There was 1 sale in October.  So, we have 15 months of inventory.  I hope, but am not expecting, sales to be more consistent.

Buford, GA is a suburb of Atlanta in Gwinnett and Hall Counties. The population is 2000 was 10,668, but that only included the area inside the city limits, and it had seen tremendous growth since that census. Buford is home to Lake Lanier, one of Georgia’s premiere recreational areas, and Lake Lanier Islands. Recently, the City of Buford has revamped their old town. It is also home to Buford (Buford City Schools aren’t a part of Gwinnett County Schools), Mill Creek, Mountain View and Lanier High School (Lanier will open for the 2010-11 school year).

I have a page dedicated to Buford Market Data.

Atlanta Metro Zillow Home Value Index

Enhanced by Zemanta

Yep… A Seller’s Market. But What Does That Mean NOW?


Supply and Demand

Supply and Demand (Photo credit: ATENCION:)

Normally, a Seller’s Market means that conditions are generally better for sellers than for buyers.  There is, in effect, more demand than there is supply.  And, usually, that means that sellers are more in control of pricing and terms for their homes.  Prices generally rise and there are fewer demands made upon sellers in regards to inspections, and other concessions.


But things aren’t always “normal”.  Now is a great example of that.

Right now, the majority of Gwinnett is solidly in Seller’s Market territory.  Below about half a million dollars, Absorption Rates remain under the magical 6 months… in some cases, even below 3 months.  Above half a million, things aren’t quite as rosy, but they are WAY stronger than they have been for years.

But all is not beer and pizza in Seller Land.  In fact, it may be FAR from fun to be a seller in today’s market, no matter what the numbers look like.  The reality is that bank-owned properties are skewing the numbers… or skewering, depending on how you want to look at it.  What has happened is that bank-owned inventory has come to dominate the market.  It may or may not be the majority, but there is enough of a presence that it pushes the pricing down for all of the homes that are actually selling.

Whether this is a good thing or a bad thing depends on whether you are a buyer or a seller.  As a buyer, it means that the homes you look are are either priced quite competitively (and don’t stay on the market very long) or they aren’t… and they stay on the market forever.

One of the ways that I can see this is by looking at the “Days on Market” (DoM) stats while preparing Market Reports.  They are jumping ALL over the place.  This isn’t a direct sign, but rather one that is more deduction.  In some segments I am seeing DoMs bounce from over 100 days to under 50 days and back over 100 in back to back to back months.  This means that homes that every once in a while a home that sells has been on the market a VERY long time… pushing up the average, then there are none of those “old-timers” the next month… then another one pops through.

What does it all mean?

Simply… as a buyer, if you see a home you like, and it is priced well, there will likely be competition for it.  Don’t expect that you can toss a low offer across the table and get a reply.  In fact, I have seen a LOT of multiple offer situations on well-priced properties.  As a seller, don’t expect that you can price your home at the level you thought it was worth a few years ago.  You are competing with bank-owned properties and their primary motivation is to not own the property any longer than they need to in order to almost break even… and their definition of break even may include insurance payments and government inducements to hurry up and sell it.

One may say that the worst aspects of both a seller’s market and a buyer’s market are present right now… fierce competition (for buyers) for the “right” properties and weak pricing for sellers).

If you really want to sell your property, let’s talk…

Enhanced by Zemanta

Buford, GA, Market Report, September 2012

This map shows the incorporated and unincorpor...

Market stats for Buford, GA, September, 2012 indicate that there were 336 properties on the market, a reduction of 28. Overall, there was about an 4.4 month supply of properties (Absorption Rate or A/R). There were 67 sales for September, down from 80 last month but up from the 79 sales last Sep11. It isn’t the strongest market in Gwinnett, but the A/R is nothing to sneeze at. It is solidly in Seller’s Market territory.

In the sub-$200k arena, there were 159 listings, with a 3.2 month supply. This is the largest price segment in this market area, so strength here usually equals strength across the whole local market area. Sales were down from last month 47 (v 49 last month), and down compared to last year (55 sales in Sep11). But, the A/R is WAY under the 6 months that would be considered fairly balanced… pointing towards a solid seller’s market.

Between $200k and $400k, there were 136 listings for sale, and about 5.8 months of supply. The 14 sales recorded were way down from the 31 last month and from the 18 sales last year for September. This had been one of the weaker segments in the county, but had improved dramatically and at current A/Rs, it is fairly balanced.

From $400k to $600k, there were 20 homes on the market. The absorption rate is 7.5 Months. There have been 8 sales in the last 3 months (4 for July, 0 for August and 4 for September). When the market is rolling, there should be 5-7 sales a month during this part of the year. Just for comparison, there were 9 sales in the July-Sep period in 2011. This segment has been bouncing all over the place… but it is VERY strong right now.

In the $600k to $800k arena, there were 9 listings. Absorption Rate is 27+ months… but it jumps around a lot. Sales in this range are pretty sporadic, but steady when looking at the long-term. The drop in inventory over the last few months from 14 homes to 9 has made things look less slow… but there were 7 sales in this segment last year including 3 sales in March, 1 in June and 0 in September.

The range from $800k to $1m, there were 3 homes listed. Trends are hardly definable. Listings are down. June recorded the first sales since December, 2012. There was 1 sale in September. But it still has a 9.0 month Absorption Rate.

Above $1m, there were 9 properties listed. There was sale in the segment in April… of 2009…and then May, 2011… and 2 sales in June, 2011… also 1 in July. There was 1 sales in September. So, we have 13.5 months of inventory. I hope, but am not expecting, sales to be more consistent.

Buford, GA is a suburb of Atlanta in Gwinnett and Hall Counties. The population is 2000 was 10,668, but that only included the area inside the city limits, and it had seen tremendous growth since that census. Buford is home to Lake Lanier, one of Georgia’s premiere recreational areas, and Lake Lanier Islands. Recently, the City of Buford has revamped their old town. It is also home to Buford (Buford City Schools aren’t a part of Gwinnett County Schools), Mill Creek, Mountain View and Lanier High School (Lanier will open for the 2010-11 school year).

I have a page dedicated to Buford Market Data.

Atlanta Metro Zillow Home Value Index

Enhanced by Zemanta

Buford, GA, Market Report, August 2012

This map shows the incorporated and unincorpor...

Image via Wikipedia

Market stats for Buford, GA, August, 2012 indicate that there were 364 properties on the market. Overall, there was about an 4.1 month supply of properties (Absorption Rate or A/R). There were 80 sales for August, down from 84 last month but up from the 75 sales last August (2011). It isn’t the strongest market in Gwinnett, but the A/R is nothing to sneeze at. It is solidly in Seller’s Market territory.

In the sub-$200k arena, there were 181 listings, with a 3.2 month supply. This is the largest price segment in this market area, so strength here usually equals strength across the whole local market area. Sales were down from last month 49 (v 53 last month), and down compared to last year (56 sales in August, 2011). But, the A/R is WAY under the 6 months that would be considered fairly balanced… pointing towards a solid seller’s market.

Between $200k and $400k, there were 143 listings for sale, and about 5.8 months of supply. The 31 sales recorded were up from the 26 last month but way up from the 17 sales last year for August. This had been one of the weaker segments in the county, but has improved dramatically and at current A/Rs, it is one of the stronger $200k-$400k segments in the county.

From $400k to $600k, there were 19 homes on the market. The absorption rate is 9.5 Months. There have been 6 sales in the last 3 months (2 for June, 4 for July and 0 for August). When the market is rolling, there should be 6-8 sales a month during this part of the year. Just for comparison, there were 6 sales in the Jun-Aug period in 2011. This segment has been bouncing all over the place… but it is VERY strong right now.

In the $600k to $800k arena, there were 9 listings. Absorption Rate is 27 months… but it jumps around a lot. Sales in this range are pretty sporadic, but steady when looking at the long-term. The drop in inventory over the last few months from 14 homes to 8 has made things look less slow… but there were 7 sales in this segment last year including 3 sales in March, 1 in June and 0 in August.

The range from $800k to $1m, there were 4 homes listed. Trends are hardly definable. Listings are down. June recorded the first sales since December, 2012. There were 0 sales in August. But it still has a 4.0 month Absorption Rate.

Above $1m, there were 8 properties listed. There was sale in the segment in April… of 2009…and then May, 2011… and 2 sales in June, 2011… also 1 in July. There were 0 sales in August. So, we have 66 months of inventory. I hope, but am not expecting, sales to be more consistent.

Buford, GA is a suburb of Atlanta in Gwinnett and Hall Counties. The population is 2000 was 10,668, but that only included the area inside the city limits, and it had seen tremendous growth since that census. Buford is home to Lake Lanier, one of Georgia’s premiere recreational areas, and Lake Lanier Islands. Recently, the City of Buford has revamped their old town. It is also home to Buford (Buford City Schools aren’t a part of Gwinnett County Schools), Mill Creek, Mountain View and Lanier High School (Lanier will open for the 2010-11 school year).

I have a page dedicated to Buford Market Data.

Atlanta Metro Zillow Home Value Index

Enhanced by Zemanta

Buford, GA, Market Report, July 2012

This map shows the incorporated and unincorpor...

Image via Wikipedia

Market stats for Buford, GA, July, 2012 indicate that there were 373 properties on the market.  Overall, there was about an 4.1 month supply of properties (Absorption Rate or A/R).  There were 84 sales for July, down from 102 last month but up from the 77 sales last July (2011).  It isn’t the strongest market in Gwinnett, but the A/R is nothing to sneeze at.  It is solidly in Seller’s Market territory.

In the sub-$200k arena, there were 196 listings, with a 3.4 month supply.  This is the largest price segment in this market area, so strength here usually equals strength across the whole local market area.  Sales were down from last month 53 (v 68 last month), and down compared to last year (61 sales in July, 2011).  But, the A/R is WAY under the 6 months that would be considered fairly balanced… pointing towards a solid seller’s market.

Between $200k and $400k, there were 139 listings for sale, and about 5.2 months of supply.  The 26 sales recorded were down from the 29 from last month but way up from the 14 sales last year for July.  This had been one of the weaker segments in the county, but has improved dramatically and at current A/Rs, it is one of the stronger $200k-$400k segments in the county.

From $400k to $600k, there were 17 homes on the market.  The absorption rate is 3.9 Months.  There have been 13 sales in the last 3 months (7 for May, 2 for June and 4 for July).  When the market is rolling, there should be 6-8 sales a month during this part of the year. Just for comparison, there were 6 sales in the May-Jul period in 2011.  This segment has been bouncing all over the place… but it is VERY strong right now.

In the $600k to $800k arena, there were 8 listings. Absorption Rate is 24 months… but it jumps around a lot.  Sales in this range are pretty sporadic, but steady when looking at the long-term.  The drop in inventory over the last few months from 14 homes to 8 has made things look less slow… but there were 4 sales in this segment last year… and 3 sales in March, 1 in June and 0 in July.

The range from $800k to $1m, there were 5 homes listed.  Trends are hardly definable. Listings are down.  June recorded the first sales since December, 2012.  There were 0 sales in July.  But it still has a 7.5 month Absorption Rate.

Above $1m, there were 8 properties listed.  There was   sale in the segment in April… of 2009…and then May, 2011… and 2 sales in June, 2011.  But there was also 1 in July.  So, we have 66 months of inventory.  I hope, but am not expecting, sales to be more consistent.

Buford, GA is a suburb of Atlanta in Gwinnett and Hall Counties. The population is 2000 was 10,668, but that only included the area inside the city limits, and it had seen tremendous growth since that census. Buford is home to Lake Lanier, one of Georgia’s premiere recreational areas, and Lake Lanier Islands. Recently, the City of Buford has revamped their old town. It is also home to Buford (Buford City Schools aren’t a part of Gwinnett County Schools), Mill Creek, Mountain View and Lanier High School (Lanier will open for the 2010-11 school year).

I have a page dedicated to Buford Market Data.

Atlanta Metro Zillow Home Value Index

Enhanced by Zemanta
Copyright © 2009 - 2019 Garage with a Detached Home | Gwinnett County GA. All Rights Reserved. Created by Blog Copyright.