Not Found buford | Garage with a Detached Home | Gwinnett County GA

LaneBailey.com

Garage with a Detached Home

Contact Lane
  • Browse Listings

    Take a look at what is currently on the market in the areas that interest you.

    Read More
  • Custom Listings

    Sign up to get notified when new listingscome on the market that meet your specs.

    Read More
  • What's YOUR Home Worth?

    Get a free Maximum Price Analysis to find out the current market value of your home.

    Read More
  • 1

Tag Archives: buford

Buford, GA, Market Report, March 2012

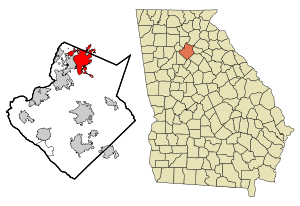
This map shows the incorporated and unincorpor...

Image via Wikipedia

Market stats for Buford, GA, March, 2012 indicate that there were 407 properties on the market. Overall, there was about an 6.0 month supply of properties (Absorption Rate or A/R). There were 86 sales for February, up from 64 last month and from the 63 sales last March (2011). It isn’t the strongest market in Gwinnett, but it is much better than it has been.

In the sub-$200k arena, there were 240 listings, with a 5.0 month supply. This is the largest price segment in this market area, so strength here usually equals strength across the whole local market area. Sales were way up from last month (61 v 40), but pretty flat compared to last year (48 sales in March, 2011). But, the A/R is under the 6 months that would be considered fairly balanced… pointing towards a slight seller’s market.

Between $200k and $400k, there were 122 listings for sale, and about 7.3 months of supply. The 19 sales recorded were down from the 23 from last month and up a bit from the 14 sales last year for March. This had been one of the weaker segments in the county, but has improved dramatically and at current A/Rs, it is one of the stronger $200k-$400k segments in the county, again, with increasing strength.

From $400k to $600k, there were 23 homes on the market. The absorption rate is 17.3 Months. There have been 4 sales in the last 3 months (1 for January, 0 for February and 3 for March). When the market is rolling, there should be 6-8 sales a month during this part of the year. September was pretty strong, and but we didn’t have the follow-up the next two months I was looking for… December was back in the right direction, and the drop in listings certainly helps. January certainly wasn’t the month to call a recovery, nor February. Just for comparison, there were 2 sales in the Jan.-Mar. period in 2011.

In the $600k to $800k arena, there were 6 listings. Absorption Rate is 3.6 months… but it jumps around a lot. Sales in this range are pretty sporadic, but steady when looking at the long-term. The drop in inventory over the last few months from 14 homes to 6 has made things look less slow… but there were 4 sales in this segment last year… and 3 sales in March.  This is a sign of strength, but the low inventory is what is driving the incredible A/R.

The range from $800k to $1m, there were 6 homes listed. But, with no sales last year (2011), obviously trends are hardly definable. Listings are down, but sales aren’t following through.

Above $1m, there were 10 properties listed. The last sale in the segment was in April… of 2009…and then there was May, 2011… and 2 sales in June, 2011. So, we have 40 months of inventory. I hope, but am not expecting, sales to be more consistent.

Buford, GA is a suburb of Atlanta in Gwinnett and Hall Counties. The population is 2000 was 10,668, but that only included the area inside the city limits, and it had seen tremendous growth since that census. Buford is home to Lake Lanier, one of Georgia’s premiere recreational areas, and Lake Lanier Islands. Recently, the City of Buford has revamped their old town. It is also home to Buford (Buford City Schools aren’t a part of Gwinnett County Schools), Mill Creek, Mountain View and Lanier High School (Lanier will open for the 2010-11 school year).

I have a page dedicated to Buford Market Data.

Atlanta Metro Zillow Home Value Index

Enhanced by Zemanta

Buford, GA, Market Report, February 2012

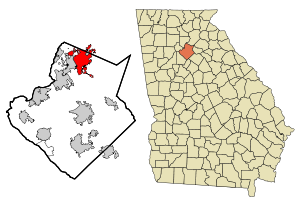
This map shows the incorporated and unincorpor...

Image via Wikipedia

Market stats for Buford, GA, February, 2012 indicate that there were 431 properties on the market.  Overall, there was about an 6.5 month supply of properties (Absorption Rate or A/R).  There were 64 sales for February, up from 52 last month but only slightly up from the 60 sales last February (2011).  It isn’t the strongest market in Gwinnett, but it is much better than it has been.

In the sub-$200k arena, there were 257 listings, with a 5.7 month supply.  This is the largest price segment in this market area, so strength here usually equals strength across the whole local market area.  Sales were slightly down from last month (40 v 42), but pretty flat compared to last year (41 sales in February, 2011).  But, the A/R is under the 6 months that would be considered fairly balanced… pointing towards a slight seller’s market.  It is heartening that despite the increase in listings, the A/R still dropped.

Between $200k and $400k, there were 126 listings for sale, and about 6.8 months of supply.  The 23 sales recorded were way up from the 8 from last month and up a bit from the 18 sales last year for February.  This had been one of the weaker segments in the county, but has improved dramatically and at current A/Rs, it is one of the stronger $200k-$400k segments in the county, again, with increasing strength.

From $400k to $600k, there were 27 homes on the market.  The absorption rate is 16.2 Months.  There have been 5 sales in the last 3 months (4 sales for December and 1 for January, 0 for February).  When the market is rolling, there should be 5-7 sales a month during this part of the year.  September was pretty strong, and but we didn’t have the follow-up the next two months I was looking for…  December was back in the right direction, and the drop in listings certainly helps.  January certainly wasn’t the month to call a recovery, nor February.  Just for comparison, there were 5 sales in the Dec.-Feb. period in 2010/2011.

In the $600k to $800k arena, there were 5 listings. Absorption Rate is 5 months… but it jumps around a lot.  Sales in this range are pretty sporadic, but steady when looking at the long-term.  The drop in inventory over the last few months from 14 homes to 5 homes has made things look less slow… but there were 4 sales in this segment last year… and 1 sale in February.

The range from $800k to $1m, there were 5 homes listed.  But, with no sales last year (2011), obviously trends are hardly definable.  Listings are down, but sales aren’t following through.

Above $1m, there were 11 properties listed. The last sale in the segment was in April… of 2009…and then there was May, 2011… and 2 sales in June, 2011.  So, we have 44 months of inventory.  I hope, but am not expecting, sales to be more consistent.

Buford, GA is a suburb of Atlanta in Gwinnett and Hall Counties. The population is 2000 was 10,668, but that only included the area inside the city limits, and it had seen tremendous growth since that census. Buford is home to Lake Lanier, one of Georgia’s premiere recreational areas, and Lake Lanier Islands. Recently, the City of Buford has revamped their old town. It is also home to Buford (Buford City Schools aren’t a part of Gwinnett County Schools), Mill Creek, Mountain View and Lanier High School (Lanier will open for the 2010-11 school year).

I have a page dedicated to Buford Market Data.

Atlanta Metro Zillow Home Value Index

Enhanced by Zemanta

Buford, GA, Market Report, January 2012

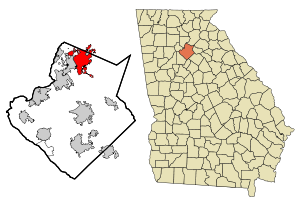
This map shows the incorporated and unincorpor...

Image via Wikipedia

Market stats for Buford, GA, January, 2012 indicate that there were 417 properties on the market.  Overall, there was about an 7.0 month supply of properties (Absorption Rate or A/R).  There were 52 sales for January, way down from 83 last month but strikingly up from the 27 sales last January (2011).  It isn’t the strongest market in Gwinnett, but it is much better than it has been.

In the sub-$200k arena, there were 246 listings, with a 5.9 month supply.  This is the largest price segment in this market area, so strength here usually equals strength across the whole local market area.  Sales were down from last month (42 v 53), but huge compared to last year (18 sales in January, 2011).  But, the A/R is under the 6 months that would be considered fairly balanced… pointing towards a slight seller’s market.

Between $200k and $400k, there were 126 listings for sale, and about 8.6 months of supply.  The 8 sales recorded were well down from the 25 from last month and up a bit from the 6 sales last year for January.  This had been one of the weaker segments in the county, but has improved dramatically and at current A/Rs, it is one of the stronger $200k-$400k segments in the county.

From $400k to $600k, there were 24 homes on the market.  The absorption rate is 9.0 Months.  There have been 8 sales in the last 3 months (3 sales for November, 4 sales for December and 1 for January).  When the market is rolling, there should be 5-7 sales a month during this part of the year.  September was pretty strong, and but we didn’t have the follow-up the next two months I was looking for…  December is back in the right direction, and the drop in listings certainly helps.  January certainly wasn’t the month to call a recovery.  Just for comparison, there were 5 sales in the Nov.-Jan. period in 2010/2011.

In the $600k to $800k arena, there were 6 listings.  Absorption Rate is 9 months… but it jumps around a lot.  Sales in this range are pretty sporadic, but steady when looking at the long-term.  The drop in inventory over the last few months from 14 homes to 6 homes has made things look less slow… but there were 4 sales in this segment last year… and 1 sale in January.

The range from $800k to $1m, there were 5 homes listed.  But, with no sales in the last year (2011), obviously trends are hardly definable.  Listings are down, but sales aren’t following through.

Above $1m, there were 10 properties listed.  The last sale in the segment was in April… of 2009…and then there was May… and 2 sales in June. So, we have 40 months of inventory.  I hope, but am not expecting, sales to be more consistent.

Buford, GA is a suburb of Atlanta in Gwinnett and Hall Counties.  The population is 2000 was 10,668, but that only included the area inside the city limits, and it had seen tremendous growth since that census.  Buford is home to Lake Lanier, one of Georgia’s premiere recreational areas, and Lake Lanier Islands.  Recently, the City of Buford has revamped their old town.  It is also home to Buford (Buford City Schools aren’t a part of Gwinnett County Schools), Mill Creek, Mountain View and Lanier High School (Lanier will open for the 2010-11 school year).

I have a page dedicated to Buford Market Data.

Atlanta Metro Zillow Home Value Index

Enhanced by Zemanta

Wayback Wednesday… Why Hyperlocal Matters in the Real Estate Market

Downtown Lawrenceville (as of June 2006)

Image via Wikipedia

Last year I was writing about why the only REAL important market report in real estate is a VERY local market report.  It’s all fine and dandy to hear the talking heads on (insert your favorite national news network), but national averages mean nothing on the state level.  Even state averages mean very little in specific counties.  In fact, looking at county level data might only be marginally relevant to a certain city in the county, and even then, there might be specific school districts or subdivisions that buck the trend… one way or another.

I run market reports for Suwanee, Lilburn, Sugar Hill, Buford, Lawrenceville, Norcross and Duluth, and it is surprising how often two cities that are right next to each other in the county will have wildly different market reports.

There is a lot more in the original post…  Hop on over and take a look.

Enhanced by Zemanta

Buford, GA, Market Report, December 2011

This map shows the incorporated and unincorpor...

Image via Wikipedia

Market stats for Buford, GA, December, 2011 indicate that there were 434 properties on the market.  Overall, there was about an 6.4 month supply of properties (Absorption Rate or A/R).  There were 83 sales for December, way up from 44 last month and even up from the 62 sales last December (2010).  It isn’t the strongest market in Gwinnett, but it is much better than it has been.

In the sub-$200k arena, there were 247 listings, with a 5.5 month supply.  This is the largest price segment in this market area, so strength here usually equals strength across the whole local market area.  Sales were well up from last month (53 v 30), but flat compared to last year (41 sales in December, 2010).  Framed in the results for the whole market area, the segment is reasonably strong.  And the A/R is under the 6 months that would be considered fairly balanced… pointing towards a slight seller’s market.

Between $200k and $400k, there were 138 listings for sale, and about 7.0 months of supply.  The 25 sales recorded were well down from the 11 from last month and from the 16 sales last year for December.  This had been one of the weaker segments in the county, but has improved dramatically and at current A/Rs, it is one of the stronger $200k-$400k segments in the county.

From $400k to $600k, there were 26 homes on the market. The absorption rate is 7.8 Months.  There have been 10 sales in the last 3 months (3 for October, 3 sales for November and 4 sales for December).  When the market is rolling, there should be 5-7 sales a month during this part of the year.  September was pretty strong, and but we didn’t have the follow-up the next two months I was looking for… December is back in the right direction, and the drop in listings certainly helps.  Just for comparison, there were 4 sales in the Oct.-Dec. period in 2010.

In the $600k to $800k arena, there were 6 listings. Absorption Rate is 18 months… but it jumps around a lot.  Sales in this range are pretty sporadic, but steady when looking at the long-term.  The drop in inventory over the last few months from 14 homes to 6 homes has made things look less slow… but there have been 5 sales in this segment in the last year… the last was five months ago until the 1 sale in December.

The range from $800k to $1m, there were 7 homes listed. And with only 2 sales in the last year (December, 2010), obviously trends are hardly definable. Listings are down, but sales aren’t following through.

Above $1m, there were 10 properties listed. The last sale in the segment was in April… of 2009…and then there was May… and 2 sales in June. So, we have 37 months of inventory. I hope, but am not expecting, sales to be more consistent.

Buford, GA is a suburb of Atlanta in Gwinnett and Hall Counties. The population is 2000 was 10,668, but that only included the area inside the city limits, and it had seen tremendous growth since that census. Buford is home to Lake Lanier, one of Georgia’s premiere recreational areas, and Lake Lanier Islands. Recently, the City of Buford has revamped their old town. It is also home to Buford (Buford City Schools aren’t a part of Gwinnett County Schools), Mill Creek, Mountain View and Lanier High School (Lanier will open for the 2010-11 school year).

I have a page dedicated to Buford Market Data.

Atlanta Metro Zillow Home Value Index

Enhanced by Zemanta
Copyright © 2009 - 2019 Garage with a Detached Home | Gwinnett County GA. All Rights Reserved. Created by Blog Copyright.