Not Found market report | Garage with a Detached Home | Gwinnett County GA

LaneBailey.com

Garage with a Detached Home

Contact Lane
  • What's YOUR Home Worth?

    Get a free Maximum Price Analysis to find out the current market value of your home.

    Read More
  • Browse Listings

    Take a look at what is currently on the market in the areas that interest you.

    Read More
  • Custom Listings

    Sign up to get notified when new listingscome on the market that meet your specs.

    Read More
  • 1

Category Archives: market report

Lilburn, GA Market Report, August 2011

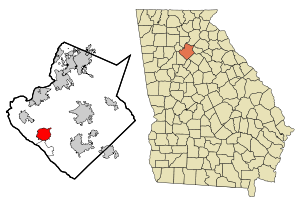
This map shows the incorporated and unincorpor...

Image via Wikipedia

Market stats for Lilburn, GA, August, 2011, indicates that there were 431 properties on the market (as of August 31st). Overall, there was about an 7.7 month supply of properties and 48 properties that closed (sold) in August.  It was an decrease from last year’s sales (51) and July, 2011 (56 sales).  The Absorption Rate notched up slightly.  Unfortunately, Lilburn is among the weakest of Gwinnett County, GA, cities I track.  But, at 7.74 months of inventory, it isn’t nearly as bad as it had been just a few months ago.
In the sub-$200k arena, there were 306 listings, with about an 6.9 month supply with 37 sales.  This represents most of the sales in the market area.  Sales decreased markedly from last month (48), and were slightly below last year (38).  This is the strongest that Lilburn has been for quite a while.  This is easily the strongest market condition for sellers in the last 2+ years (I only have full data back 2 years right now).

Between $200k and $400k, there are 114 listings for sale, and about 11.o months of supply.  This segment had been quite weak for months, and has stalled a little.  There were 11 sales compared to 9 last year.  But, the last time we had an absorption rate under 11 months was in December of 2009.  This segment really needs to get back into single digits… but Lilburn has never been seen as a luxury market.

From $400k to $600k, there are just 5 homes on the market. The absorption rate is 5.0 months. There were no sales in this segment from December through February, but there were 2 in March, which really turned the segment around, followed by 1 sale for April.  May posted 2 sales, 1 sale in June, 2 in July and none in August.

From $600k to $800k, $800k to $1M and Above $1M, there are 6 listings (combined), but too few sales to have any sort of reliable number of months of inventory.  March posted the first sale since August, 2010.  It was in the $600-$800k range. One of the listings is above $1M and one between $800k and $1M, and there is no market activity in the last 12 months for those ranges…

Lilburn is in Gwinnett County, GA, just outside of Atlanta. As of the 2000 Census, there were 11,307 people in Lilburn, but that is only including people in the city limits, and there has been a lot of growth since 2000 in Gwinnett County. It was incorporated in 1910. Lilburn is home to Parkview High School, and also has students that the Brookwood, Berkmar and Meadowcreek clusters. It is also home to Killian Hill Christian School, Providence Chrisian Academy, St. John Neumann Catholic School and Parkview Christian School. Possibly the most famous resident of Lilburn is General Beauregard Lee, a groundhog with a better winter prediction record that Puxatawnee Phil up in PA. Dominique Wilkins, formerly of the Atlanta Hawks also lives in Lilburn.

Atlanta Metro Zillow Home Value Index

I have a page dedicated to Lilburn Market Data.

Enhanced by Zemanta

Change to Local Market Reports

Image representing Zillow as depicted in Crunc...

Image via CrunchBase

As a real estate agent, I run across a lot of cool tools.  Some of them are great for me to better read the markets and help buyers and sellers to accomplish their goals.  Other tools are great for consumers to use while making decisions about buying or selling a home.

I always recommend that both buyers and sellers look at the local market where they are buying or selling.  It has a tremendous bearing on whether prices are on the rise or falling, as well as what the competitive environment might be.  Looking at a solid CMA (Comparative Market Analysis) for the home (that they are selling or looking at buying) is a great start… but it doesn’t give the wide picture.


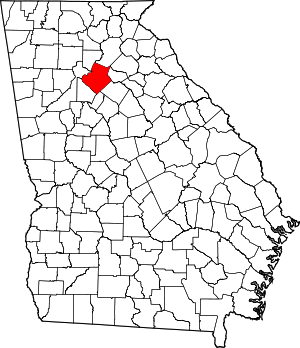
Map of Georgia highlighting Gwinnett County

Image via Wikipedia

Many buyers and sellers turn to AVMs (Automated Valuation Models) to get an idea of the value of a home.  Probably the most well known of these would be the Zillow Zestimate.  I have written about Zillow and their Zestimates a few times.  Zestimates are amazing tools… within the bounds of their limitations.


While I would quickly point out that Zestimates are a very limited tool in regards to pegging the value of a particular property, one thing I will point out just as quickly is that the Zestimates have given Zillow an amazing database of historical and current home values.  And while individual Zestimates are seldom right, I feel that their compiled data is quite accurate (1 house is too small a sample size to be accurate, but 10,000 houses can make them very accurate in pegging the market in general).

I will be incorporating Zillow’s Local Area Indexes into my Market Reports moving forward.  I think that they are a valuable tool for you, the consumer, to better assess the market value of homes that you might be considering.  Look for charts like this one for various areas within Gwinnett as part of market reports.

Atlanta Metro Zillow Home Value Index

Enhanced by Zemanta

Mortgage Rates Lowest in 50 Years… according to Freddie Mac

Freddie Mac

Image via Wikipedia

Freddie Mac issued their Primary Mortgage Market Survey yesterday, and the rates are unbelievable.  Let me click off a few quotes from the Press Release.

30-year fixed-rate mortgage (FRM) averaged 4.15 percent with an average 0.7 point for the week ending August 18, 2011, down from last week when it averaged 4.32 percent. Last year at this time, the 30-year FRM averaged 4.42 percent.

15-year FRM this week averaged 3.36 percent with an average 0.6 point, down from last week when it averaged 3.50 percent. A year ago at this time, the 15-year FRM averaged 3.90 percent.

5-year Treasury-indexed hybrid adjustable-rate mortgage (ARM) averaged 3.08 percent this week, with an average 0.5 point, down from last week when it averaged 3.13 percent. A year ago, the 5-year ARM averaged 3.56 percent.

1-year Treasury-indexed ARMaveraged 2.86 percent this week with an average 0.6 point, down from last week when it averaged 2.89 percent. At this time last year, the 1-year ARM averaged 3.53 percent.

I guess that is the upside of economic stagnation.  And when combined with the amazing prices on homes in the market right now, it makes for a GREAT time to buy property.  Assuming that you don’t have to sell first.

And that is the flip side.  Many would be buyers are sidelined because they can’t afford to sell their current home.  The best they can hope for is to re-finance with the low rates… of course, that isn’t helping those that have a need to relocate.

Enhanced by Zemanta

Norcross, GA, Market Report, June 2011

DSCN0584

Image by lane.bailey via Flickr

Market stats for Norcross GA, June, 2011 indicate that there were 360 properties on the market (385 for May). Overall, there is about a 5.8 month supply of properties (7.2 months last month). This year has been very strong so far… although it has slowed the last two months… it hasn’t slowed much.  June saw 85 sales, WAY above the 52 for May and the 62 for last June, and with the decrease in listing inventory the Absorption Rate (AR) built more strength.  This is one of the few market areas in Gwinnett to post five strong months in a row.

In the sub-$200k arena, there were 208 listings (225 last month), with about 4.1 month supply (5.4 for May).  Sales are up sharply from a year ago in this segment, which is the main driver of sales in this area (68 v 38).  For the last three months, the AR has been tilted in favor of sellers… it got a little more so, this month.  This looks like the strongest price/area segment in Gwinnett County, GA.

Between $200k and $400k, there were 152 listings for sale (120 in May), and about 18.2 months of supply (last month it was 18.0).  As strong as the under $200k segment is… this one is weak.  The 15 sales were a drop from last year’s 18 sales, but a good bump from last month’s 7 sales.  Of course, this segment has always seemed to lag.

From $400k to $600k, there were 44 homes on the market (34 last month). The absorption rate is around 16.5 months (8.5 in May).  The Absorption Rate has been dropped for 5 months, then shot WAY up this month.  June’s 1 sale is down from 5 the month before and last year’s 4 sales… and the inventory increase didn’t really help.

In the $600k to $800k arena, there were 8 listing on the market (1 last month).  Inventories had decreased as sales have increased compared to last year.  The absorption rate is at 12 months of inventory (1.5 last month, but only 1 listing)… but with only 4 sales last year and then the sale in March and another each in May and June, obviously it is easy to bump one way or the other. The ONLY reason for the strong looking Absorption Rate last month was that there was only 1 listing.  

The range from $800k to $1m, there was 1 homes listed on the market and no sales… seemingly forever.

Above $1m, there were 4 properties listed.  But because of the smaller numbers of sales, the absorption rate could be significantly impacted by just a couple of sales.  The single sale in January (first since October) has pushed the Absorption Rate down to 24 months of inventory.

Norcross, GA is a suburb of Atlanta in Gwinnett County. The population is 2000 was 8,41, but that only included the area inside the city limits, and it has seen tremendous growth since that census. The City of Norcross revamped their old town a long time ago, and it has served as a model for other towns in the area. It is also home to Meadow Creek and Norcross High Schools. One of the things that Norcross is known for locally is the beautiful older homes in the downtown area. They have maintained their historic flair quite successfully.

I have a page dedicated to Norcross Market Data.

Enhanced by Zemanta

Buford, GA, Market Report, June 2011

DSCN0593

Image by lane.bailey via Flickr

Market stats for Buford, GA, June, 2011 indicate that there were 603 properties on the market (584 last month). Overall, there was about an 7.4 month supply of properties (8.3 last month).  There were 97 sales for April, up slightly from 75 last month and 83 from last June (2010).

In the sub-$200k arena, there were 312 listings (313 last month), with a 5.4 month supply (6.1 for May).  This is the largest price segment in this market area, so strength here usually equals strength across the whole local market area.  Sales were up from last month (67 v 54), and quite strong compared to last year (48 sales in June, 2010).  Framed in the results for the whole market area, the segment is quite strong.

Between $200k and $400k, there were 224 listings for sale (213 for May), and about  10.5 months of supply (12.1 last month).  The 25 sales recorded were significantly above the 17 from last month, but well down from the 32 sales last year for June.  It is a mid-pack price/area segment in Gwinnett County, GA.  Of course, if there were another big bump next month…

From $400k to $600k, there were 41 homes on the market (36 last month). The absorption rate is almost 24.6 Months (54 last month).  This shouldn’t be acting like a high-end luxury segment, but it is.  There has been 5 sales in the last 3 months (3 sales for June, 2 for May).  When the market is rolling, there should be 5-7 sales a month during this part of the year.  And despite the lower market segments getting better, this one has been weak.

In the $600k to $800k arena, there were 5 listings (4 listings in May).  Absorption Rate is 15 months (6 months measured last month)… it jumps around a lot.  Sales in this range are pretty sporadic, but steady when looking at the long-term.  The drop in inventory over the last few months from 14 homes to 4 homes has made things look less slow… but there have been 5 sales in this segment in the last year… the last was last month.

The range from $800k to $1m, there were 11 homes listed (up 4 from May). And with only 1 sale in the last year (Feb 10) until last December (2 more), obviously  trends are hardly definable.  At least listings are down by more than compared to a few months ago (9 listings in June).

Above $1m, there were 10 properties listed (down 1 from May).  The last sale in the segment was in April… of 2009…and then there was May… and 2 sales in June.  FINALLY, new sales!

Buford, GA is a suburb of Atlanta in Gwinnett and Hall Counties. The population is 2000 was 10,668, but that only included the area inside the city limits, and it had seen tremendous growth since that census.  Buford is home to Lake Lanier, one of Georgia’s premiere recreational areas, and Lake Lanier Islands.  Recently, the City of Buford has revamped their old town. It is also home to Buford (Buford City Schools aren’t a part of Gwinnett County Schools), Mill Creek, Mountain View and Lanier High School (Lanier will open for the 2010-11 school year).

I have a page dedicated to Buford Market Data.

Related articles
Enhanced by Zemanta
Copyright © 2009 - 2019 Garage with a Detached Home | Gwinnett County GA. All Rights Reserved. Created by Blog Copyright.