Not Found real estate | Garage with a Detached Home | Gwinnett County GA

LaneBailey.com

Garage with a Detached Home

Contact Lane
  • Browse Listings

    Take a look at what is currently on the market in the areas that interest you.

    Read More
  • What's YOUR Home Worth?

    Get a free Maximum Price Analysis to find out the current market value of your home.

    Read More
  • Custom Listings

    Sign up to get notified when new listingscome on the market that meet your specs.

    Read More
  • 1

Category Archives: real estate

Garage Values…

I’ve been working on some statistics for valuing additional garages.  It is tough.  They are a specialized addition, not unlike equestrian facilities, pool or tennis courts are for other families…

ROD WORKS SHOP

ROD WORKS SHOP (Photo credit: ATOMIC Hot Links)

Appraisers have been all over the map, but for the last couple of years they have consistently under-valued enthusiast garages.  I have seen $50k-$70k garages valued under $10k during the appraisal process.

A large part of that is due to the fact that actual market value numbers are seldom worked up for specialty garages.  The buyers see the additional value, and of course the sellers see the additional value.  But too often, the appraisal gets in the way of completing the sale.

As a real estate agent, I can NOT do appraisals, but I can provide limited guidance to appraisers to help them see the additional value that should be added for an enthusiast garage.

For a recent property, I worked up an area wide study of similar garages.  The results were a little surprising.  Keep in mind, these were specific to the type of garage I was trying to find comps for… in this case, the house had an attached, over-sized 2 car garage and a detached VERY over-sized workshop garage (around 900square feet).  I controlled price range to be similar to the subject home.  Looking for direct comps was fruitless, but I was able to find other homes with detached garages, generally in the 500sf range.  In each case, there was only one home with the bonus garage.  So, I looked for comparable homes without the bonus garage to compare the difference in prices.

  • Subdivision 1 – Average difference was $23,300.
  • Subdivision 2 – Average difference was $10,500.
  • Subdivision 3 – Average difference was  $53,615.
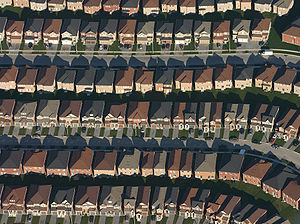
An aerial view of housing developments near Ma...

An aerial view of housing developments near Markham, Ontario. Photo by IDuke, November 2005. (Photo credit: Wikipedia)

In the case of subdivision 2, there were only two houses, one with and one without the big garage.  The house without the big garage had been fully updated with a new kitchen, granite counters, stainless steel appliances, upgraded bathrooms, etc.  The house with the garage had laminate counters, old appliances and had not been updated for at least 15 or 20 years of its 33 year life.  That would lead me to believe that the market values of the homes was actually considerably wider than it first looks.  And, I believe the opposite to be true of Subdivision 3… the Garage Home was considerable nicer than the non-garage comparables.

However, this shows pretty solidly that the additional garage is more likely worth $20k-$30k, rather than the $5k-$10k that many appraisers will initially allow for the structure.  That also puts it in line with Remodeling Magazine’s annual Cost vs Value study garage data.  That puts the mid-range garage cost at around $46k while the value at sale is around $30k.

Appraisals are great when you are looking at a cookie cutter home.  Those are easy… it’s when the mold is a little different that things get sticky.  Of course… you need an agent that is willing to invest the time to fight a low appraisal.  Even as a buyer, if the appraisal doesn’t come back at a price the seller can work with, you won’t be able to get financing…  Give Lane a call.

Enhanced by Zemanta

Norcross, GA, Market Report, March 2013

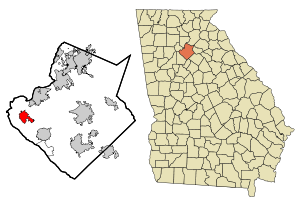
This map shows the incorporated and unincorpor...Market stats for Norcross GA, March, 2013 indicate that there were 136 properties on the market, down 7 from last month. Overall, there is about a 3.6 month supply of properties. The last year has been fairy strong… it hasn’t slowed much, if at all. March saw 44 sales, well up compared to the 32 for February, but down compared to the 51 for March last year.

In the sub-$200k arena, there were 72 listings, with about 3.0 month supply. Sales are up from last month and way down from a year ago in this segment, which is the main driver of sales in this area (25 v 20 in Feb13 & 42 Mar12). For the last two years, the AR has been tilted in favor of sellers. This still looks like one of the strongest price/area segment in Gwinnett County, GA. At a 2.96 month A/R, this is pretty strong for sellers.

Between $200k and $400k, there were 41 listings for sale, and about 3.8 months of supply. This segment had been weakening for the last few months. But, the 15 sales were up from last year’s 11 sales, and last month’s 9 sales. Even though it isn’t as gangbusters as some of the other areas, it is certainly better than the 28 months of inventory we had in December, 2010. I think this is starting to look like a pretty settled market here…

From $400k to $600k, there were 20 homes on the market. The Absorption Rate is around 8.6 months. The AR had been fairly steady all summer, then shot WAY up in September/October. March’s 4 sales were up from the 3 last month and from last year’s 3 sales. This had actually been a pretty good area for homes in this price range to sell… The good news is that it only takes a few sales to put it back in a balanced range long term. In June we were at just 5.1 months of inventory and five months ago it was 42 months…

In the $600k to $800k arena, there were 2 listings on the market. The Absorption Rate is at 12.0 months of inventory… but with only 4 sales in 2010 and 4 sales in 2011, obviously it is easy to bump one way or the other. One reason for the strong looking Absorption Rate last month was that there were so few listings. The were 0 sales for Mar13, 0 for Feb13 and for Mar12.

The range from $800k to $1m, there were 0 homes listed on the market and 0 sales in February. There were no sales last year. Unfortunately there isn’t enough data for a good A/R number.

Above $1m, there was 1 property listed. But because of the smaller numbers of sales, the absorption rate could be significantly impacted by just a couple of sales. There is simply not enough activity for an A/R figure. The last sale was January 2011.

Norcross, GA is a suburb of Atlanta in Gwinnett County. The population is 2000 was 8,410 but that only included the area inside the city limits, and it has seen tremendous growth since that census. The City of Norcross revamped their old town a long time ago, and it has served as a model for other towns in the area. It is also home to Meadow Creek and Norcross High Schools. One of the things that Norcross is known for locally is the beautiful older homes in the downtown area. They have maintained their historic flair quite successfully.

I have a page dedicated to Norcross Market Data.

Atlanta Metro Zillow Home Value Index

Enhanced by Zemanta

Duluth, GA, Market Report, March 2013

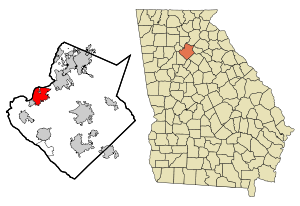
This map shows the incorporated and unincorpor...

Image via Wikipedia

Market stats for Duluth, March, 2013 indicated that there were 286 properties on the market, down 1 from last month. Overall, there was about a 5.3 month supply of properties. Sales in March were 76, up from 75 a year earlier. Sales were WAY UP compared to the prior month (40). Duluth had been slightly leading Gwinnett County as a whole, but not so much over the last few months. It is slightly in the Seller’s Market zone.

In the Under $200k arena, there were 82 listings in Duluth, GA, with about a 3.3 month supply. The Absorption Rate for last March, was 5.1. Sales were WAY down this year v last year (35 v 44), but up compared to last month (20). The Absorption Rate (A/R) is a bit better than most of the county…

Between $200k and $400k, there are 83 listings for sale, and about 4.4 months of supply. Absorption rates have similarly risen, dropped and then risen again. Sales were up compared to March, 2012 (26 v 19) and compared to last month (15). Duluth is a market that favors luxury, but this segment is not doing as well as I would have expected… but it might be constrained somewhat due to low inventories. It is still a Seller’s Market.

From $400k to $600k, there were 37 homes on the market. The Absorption Rate was around 12.3 months. March brought in 3 sales. There were 6 last year and 2 last month. Unlike many of the market areas, Duluth is a luxury centric market, and it is doing better than the rest of Gwinnett County, GA, especially at this price level. This moth saw a HUGE jump in the A/R. We are now well to the Buyer’s Market side.

In the $600k to $800k arena, there were 22 listings, with about 5.1 months of supply. Sales were 9 for March… 3 for last year. And month to month sales were up drastically (9 v 1). I would like to see three consecutive months with strong sales, and haven’t seen that for a while. Since Duluth does favor luxury sales, it has been looking better than the much of the rest of the County at this price level. That A/R is great, but not stable.

In Duluth, GA, from $800k to $1m, there were 22 homes listed and approximately 22 months of inventory on the market. The 1 sale for March was not better than the 2 last year or the 1 last month. Sales haven’t been moving much for the last couple of months, but 3 sales for the last 3 months was the better than the same 3 months from last year (2 sales).

Above $1m, there were 40 properties listed. The current absorption rate indicated about 30 months of inventory. A couple of sales at this level could have a large impact on the Absorption Rates. There were 4 sales in the Jan-Mar period this year, and 2 for the same time last year. We should be posting four sales a month here regularly… and we fell short last month but barely had a start with it this month with 2 sales. There was 1 sale last year and there was 1 for last month.


Duluth, GA is a suburb of Atlanta, in the heart of Gwinnett County. It actually straddles the county line and has unincorporated portions in South Forsyth County. The population of Duluth is estimated as about 26,000 people as of 2008, but this doesn’t include unincorporated areas outside the city limits, but with a Duluth mailing address. It is also home to Sugarloaf Country Club, a PGA stop until recently. Forbes Magazine rated Duluth 26th in their nationwide survey of the best places to move, and it is one of the wealthiest parts of Georgia. It is also home to the Arena at Gwinnett Center (Home of the ECHL Gwinnett Gladiators) and the former Atlanta Thrashers practice facility (the Duluth Ice Forum). There is a LONG list of celebrities and athletes that call Duluth home, largely because of the country clubs and proximity to Atlanta.

Atlanta Metro Zillow Home Value Index

I have a page dedicated to Duluth Market Information.

Enhanced by Zemanta

Garbage In… Garbage Out…

Garbage Only

Garbage Only (Photo credit: Peter Kaminski)

It is an axiom among data types… Garbage in = garbage out.  you can’t derive good data from bad.  If you put garbage into the system, you are destined to get garbage back out.

MLS (Multiple Listing Service) data is the same way.  Real Estate Agents have to use strange and unique search patterns to overcome the bad data put in by other real estate agents… in some cases because the inputting agents are lazy, in others because they are incompetent… or a combination.  Mix in some “over-confidence” because they “have been doing this forever and don’t you dare think you can tell them what’s what” for good measure.

In this case, I’m talking about school district data.

Some of Butte's School Buildings (1915)

Some of Butte’s School Buildings (1915) (Photo credit: Butte-Silver Bow Public Library)

One of the main motivators people have in looking at a certain area will revolve around picking the best schools they can find.  In fact, the last areas to go down in value and the first to begin to rise are those with solid schools.  And the areas with solid schools had less of a slide to begin with.

Getting the schools right is a BASIC part of our jobs.

Unfortunately, we can’t rely on the seller (home owner) to know which schools serve their area.  Unless they currently have children in all of the schools, their data may be out of date.  Sometimes, even when they DO have kids in school.

In the case of one local area, there was a re-districting that went into effect in June, 2010.  A new High School, Middle School and Elementary School were added in the area.  But, we are almost 3 years into this change.

You’d think that agents would have a handle on it…

Wheelwright's tools

Wheelwright’s tools (Photo credit: Wikipedia)

Well, you’d be wrong.  In fact, you’d be wrong 30% of the time.  Yep, out of 210 listings in this High School cluster, 64 of them had bad school data.  Usually one wrong school out of three… sometimes two.  I didn’t look to see if they were in the wrong cluster totally…  The one area that really surprised me was that 2 of them were new construction.

One of the tools that EVERY agent needs to use is the online data from school systems.  Granted, some school systems are a decade behind the times on getting districting maps online, but that is NOT the case here in Gwinnett.

But often, agent think they know the schools (since they have been an agent in this area since it was farmland) or the look to see what other agents have put in for the neighborhood… or worse yet, they look at the schools listed by Trulia (which can even be in the wrong county).  So, they don’t spend 10 minutes checking online.

I expected that with the agents listing bank-owned properties over the last few years.  They were churning their listings, not caring about serving the needs of buyers.  But as we have moved back into an era of private sellers again, I’m a little surprised at how few agents have the right info…

And Where Does This Go?

WRONG WAY

WRONG WAY (Photo credit: CarbonNYC)

First… as a seller, how many buyer searches are you missing out on because your agent doesn’t have basic information like schools entered properly?  Buyer search by school…  And they BUY based on schools they search.

Second… if they aren’t paying attention to things like schools, what other details are they not noticing?  I run across poor descriptions, bad pictures and other faulty data all of the time.

Third…  how much actual money or time are YOU wasting, as a seller, while buyers skip past your home because the data isn’t correct?  The average days on market for homes listed in this cluster over the last year with the RIGHT info is 86.  The average for homes listed with the WRONG data is 108.  Do YOU want to spend an extra 22 days on the market… almost an extra full house payment?

Fourth… and this is the one I don’t have the ability to find data for… how many times were homes put under contract, only to fall out of contract when the buyers discovered that they weren’t in the school system they thought?  How much missed market time was there?

Want to know more? Give Lane a call…


Enhanced by Zemanta

Lawrenceville, GA Market Report, March 2013

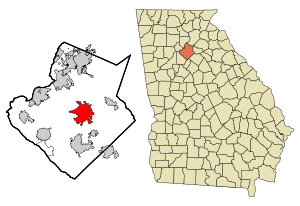
This map shows the incorporated and unincorpor...

Image via Wikipedia

Market stats for Lawrenceville, GA, March, 2013, indicate that there were 606 properties on the market, down 27 from last month. Overall, there was about a 3.3 month supply of properties. In 2012, sales for March were at 275, so 217 sales was a big decrease, year over year. Last month’s sales were at 170. But, coupled with the decrease in inventory, things are still looking pretty good. Normally the market picks up from January-February through about June-August. This month we are OK, but some are arguing that constrained inventories are still holding back sales or we could be looking even better. In almost every market I follow in Gwinnett, there was an increase in listings… except here.

For Lawrenceville, GA, Homes Under $200k, there are 467 listings, with about a 2.9 month supply of homes. Sales were down from March, 2012 (174 v 260), although sales may very well be off because of constrained inventories. Last year in this segment, there were almost 900 listings v under 500 now. This segment is easily the lion’s share of sales for the area. With the 2.99 month A/R, it is solidly in Seller’s Market territory. The low Absorption Rate (AR) is due to very strong sales, coupled with dramatically lower listing inventories. Month over month sales were up from 154 last month. Again, there was a big drop in listed properties for this month.

Between $200k and $400k, there are 126 listings for sale, and about 5.4 months of supply. Oddly, this had one of the mid-pack segments in the county, now it’s on the weak side. The 42 sales for March, 2013 trounced the 14 from last year, and killed the weak 16 sales last month. We had been close but slipped back into Seller’s Market territory here… again.  Last month we were in a Buyer’s Market.

From $400k to $600k, there are 9 homes on the market. The absorption rate is around 13.5 months. However, with the level of sales in this segment, a couple of sales added or subtracted can have a HUGE impact. There was 1 sale for March, the Absorption Rate has dropped from 78 months June11, through good, but sporadic sales. This is acting like a luxury market and the A/R is jumping all over the place… with just a few sales (A/R was 34 10 months ago and 4.5 three months ago). While the long term trend was looking a little better, now it is still pretty choppy.

In the $600k to $800k arena, there are 2 listings, with about 8 months of supply. As with the next lower priced segment, a couple of sales makes a big difference and there were 0 sales in March. There were only 6 sales at this level in all of 2011. There were 4 sales in 2012.

Between $800k and $1M, and Above $1M there are 2 homes listed (combined) and not enough sales data to give an accurate absorption rate. Until this month, there had only been one sale in this range in the last 3 years (Aug, 2010), according to FMLS. But, there was 1 sale in July 12. It was over $1M, if that makes a difference…


Lawrenceville is in Gwinnett County, GA, just outside of Atlanta. As of the 2000 Census, there were 22,937 people in Lawrenceville, but that is only including people in the city limits, and there has been a lot of growth since 2000 in Gwinnett County (2008 estimates from the Census Bureau peg population around 29,000). It was incorporated in 1821. Lawrenceville is home to Central Gwinnett High School, and also has students that the Mountain View and Archer clusters. It is also home to Gwinnett Technical College and Georgia Gwinnett College. Another recent addition to Lawrenceville is that it is home to the Gwinnett Braves, playing at the Gwinnett Stadium on GA20 between I-85 and GA316. Possibly the most famous resident of Lawrenceville was Oliver Hardy. As a small boy he lived in Lawrenceville with his parents for a short time. Lawrenceville was also home to Junior Samples. Some of its other residents included Jeff Francouer, Brian McCann and Jennifer Ferrin.


Atlanta Metro Zillow Home Value Index

I have a page dedicated to Lawrenceville Market Data.

Enhanced by Zemanta
Copyright © 2009 - 2019 Garage with a Detached Home | Gwinnett County GA. All Rights Reserved. Created by Blog Copyright.