Not Found business of real estate | Garage with a Detached Home | Gwinnett County GA

LaneBailey.com

Garage with a Detached Home

Contact Lane
  • What's YOUR Home Worth?

    Get a free Maximum Price Analysis to find out the current market value of your home.

    Read More
  • Custom Listings

    Sign up to get notified when new listingscome on the market that meet your specs.

    Read More
  • Browse Listings

    Take a look at what is currently on the market in the areas that interest you.

    Read More
  • 1

Tag Archives: business of real estate

Zestimate Accuracy in the Atlanta GA Area…

Representation of high accuracy and low precision.
Image via Wikipedia

Ever since they were first introduced, Zillow’s ‘Zestimates’ have created a stir.  Some herald them, while other decry them.  But, Zillow’s Zestimates are a great tool for homeowners and those looking at buying, whether they are familiar with the area or not.

But the Zestimates DO have a limit.  They aren’t terribly accurate.  On the good side, though, Zillow is nice enough to tell us how accurate they are for some areas.  But, even the accuracy may need to be interpreted.

Let’s see if we can shed some light on Zestimate accuracy for the Atlanta, GA, area. For the sake of this example let’s assume that the Zestimate is exactly $200,000.  This is a nice, round number that makes calculations easier.

  • Median error for the Atlanta area is 15.3%.  That means that half of the homes have an error of less than 15.3%, while half have an error higher than 15.3%.  In other words, half of the homes that would be valued at $200,000 are worth between $169,400 and $230,600.  the other half are worth more than $230,600 or less than $164,900 (should be around 25% too high, 25% too low).
  • About 58% are actually worth between $160,000 and $240,000.
  • About 36% are worth between $180,000 and $220,000.
  • Only 19% are worth between $190,000 and $210,000.

The bottom line is that Zestimates, in the Atlanta area, are pretty rough.  There is only a 1 in 5 chance of the home’s value being within 5% of the Zestimate.  In other words, it is not a precision tool…

In my experience, most sellers are sure that the Zestimate is too low, and most buyers are convinced it is too high.  It is just as likely to be one as the other…

But Zestimates ARE still useful…

Like any tool, they need to be used the right way.  My Zillow contacts (and I have met and enjoyed talking with several of the fine folks at Zillow) have stated that the distribution of Zestimate error is just as likely to be high as low.  Look at the target in the graphic.  None of the shots hit the center of the target… but the AVERAGE of them is quite close.  And the same holds true of Zestimates.

Taken as a whole, when looking at larger areas (the larger, the better), they provide a very accurate look at the broader market.  But, as we narrow down to more specific areas, they get cloudier and cloudier.

Enhanced by Zemanta

Wayback Wednesday… Is NOW the Time to Buy?

National Association of Realtors streetscape
Image by dannyfowler via Flickr

Listening to the NAR (National Association of Realtors®, it is ALWAYS the right time to buy.  If the market is going up, they pound the “buy the rising market” drum.  If the market is going down, they beat on the “buy into value” drum.  Frankly, I’m tired of it, and they have killed a massive amount of credibility by constantly trying to spin reality for “our” perceived benefit.

A couple of years ago this week, I was on Social Media Edge, on Blog Talk Radio, talking with Ken Cook about this very thing.  I’ve had my strong opinions about this for quite a while.  And, while for some folks, it is a GREAT time to buy, for others it isn’t.  I haven’t ever been shy about saying it, even when I have taken flak from my peers for not “cheerleading the market”.

On Social Media Edge, we talked for about 20 minutes about this.  Here is a link to the original post, and it has links to the Blog Talk Radio site, as well as a podcast of the broadcast.  Stop in, check it out.

If you are wondering if NOW is the time for you to buy, give Lane a call.  678-200-5895.

Enhanced by Zemanta

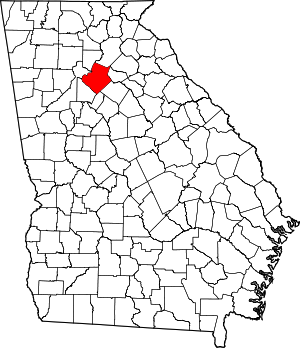
Gwinnett County GA Overall Market Report… October, 2010

Map of Georgia highlighting Gwinnett County
Image via Wikipedia

So, let’s get to the numbers and try to get a handle on what they mean.

At the end of October, 2010, there were 6,138 homes on the market in Gwinnett County, GA.  As expected, there has been a general upward trend in the number of listings all year, but that was slowing… as expected, but bumped up this past month, which wasn’t expected.  While this is a lot of listings, it is low compared to the 10,000+ listings that were on the market a couple of years ago.  There were 553 sales in October.  This was down from 767 sales for October, 2009.  Averaging the result for the last three months yielded an Absorption Rate of 10.8 months of inventory.  Which has been steadily increasing since June (this isn’t an increase that is good).  This has been pretty consistent across the board on price and location segments, although not exactly the same in all areas.

The Under $200,000 market segment was the meat in this sandwich.  For August, it represented 3,885 homes listed.  There were 435 sales during that period.  Averaging the last three month gave the segment an Absorption Rate of 9.1 months.  The rate has been rising since May (rather than the more “market normal” June), having bottomed at just under 7.2 months of inventory.  Year over year sales for October were down from 532 in October, 2009.

In the $200,000 to $400,000 range, there were 1,690 listings county-wide.  The Absorption Rate, currently at about 13.7 months of inventory, has been rising since August.  And while sales are down, listings are down more, which is driving the absorption rate down.  Year over year sales were down significantly, 116 for 2010 v 208 for 2009.  In effect, while there are about half of the listings of the next lower market segment, there are barely more than a quarter of the sales.

Between $400,000 and $600,000, there were 329 listings in Gwinnett County and 6 sales for October, 2010.  Again, the Absorption Rate had been basically dropping since March, 2010, but jumped up significantly based on weak sales.  Currently it indicates about 31.7 months of inventory.  Inventories are down slightly, but sales are abysmal v last year.  For October, 2009, there were 24 sales.  I can only hope there are some sales that are very late going into the system

In the $600,000 to $800,000 strata, the Absorption Rate indicates 27.3 months of inventory.  That rate has been rising since July (it was 10 months, then).  But, in February there was a 38 month inventory of properties.  For October, there were 82 listings in this price range.  There were 2 sales… down from 4 in October, 2009.

As we move up to the $800,000 to $1,000,000 price level of Gwinnett County, GA, homes for sale, we see that there were 49 active listings and 1 sale for October, 2010.  This has an indicated Absorption Rate of 61 months of inventory.  Because the sales at this price level are less consistent than at lower levels, the rate bounces around a lot.  But, there is an upward trend in the absorption rate… which isn’t good.

On the top level, Over $1,000,000, there were 103 listings and 4 sales for October, 2010.  Here we have seen the Absorption Rate on the increase, despite the inventory dropping.  For August there was about 26 months of inventory.  Sales are up significantly from last year (when there were 0 sales…).  Since this is a very wide range (prices from $1,000,000 to over $10,000,000), there are more listings and sales than the next level down.  Also, the homes are generally harder to compare because this realm is populated with custom homes and “one-offs”.

I’m looking forward to seeing the sales data for November soon.

You might have noticed that these reports lag by a month to a month and a half.  The reason for the lag is that it takes until the end of the following month for the data to stabilize.  So, the data for October wasn’t very solid until the beginning of December.  I have tried to use preliminary data, but it always seemed to veer at the last minute…

Enhanced by Zemanta

Norcross, GA, Market Report, October 2010

Norcross shopping district and downtown
Image via Wikipedia

Market stats for Norcross, October, 2010 indicate that there were 390 properties on the market. Overall, there is about a 8.5 month supply of properties. October and September sales were down v 2009 (42 v 57 and 43 v 55), but August was way up (52 v 43).  Overall, the market isn’t terrible here, looking back.

In the sub-$200k arena, there were 211 listings, with about 6.3 month supply.  Sales are way down from a year ago in this segment, which is the main driver of sales in this area.  But the segment is still looking pretty strong, despite the weakness in July and September and relative weakness of sales in October.

Between $200k and $400k, there were 133 listings for sale, and about 14.8 months of supply.  Sales have been down and slowing for the last few months.  But October was down (4 v 13 last year).  With the increase in inventory.

From $400k to $600k, there were 40 homes on the market. The absorption rate is around 15 months.  Sales have actually been strengthening since March (with a few ups and downs…), but much of the perception is from shrinking inventories.  Actual sales have been mostly decelerating.  I expect to see the numbers move the other way in the next few months.

In the $600k to $800k arena, there were 3 listings on the market.  Inventories have decreased as sales have increased compared to last year.  The absorption rate (three month average) is at 9 months of inventory… but with only 4 sales this year, obviously it is easy to bump one way or the other.

The range from $800k to $1m, there were 1 homes listed on the market and no sales… seemingly forever.

Above $1m, there were 3 properties listed.  But because of the smaller numbers of sales, the absorption rate could be significantly impacted by just a couple of sales.  There have been three sales in the last year (Nov 09, Apr 10 and Sept 10).

Norcross, GA is a suburb of Atlanta in Gwinnett County. The population is 2000 was 8,41, but that only included the area inside the city limits, and it has seen tremendous growth since that census. The City of Norcross revamped their old town a long time ago, and it has served as a model for other towns in the area. It is also home to Meadow Creek and Norcross High Schools. One of the things that Norcross is known for locally is the beautiful older homes in the downtown area. They have maintained their historic flair quite successfully.

I have a page dedicated to Norcross Market Data.

Enhanced by Zemanta

Flashback Friday… Absorption Rates, What Are They?

<20% <25% <30%
Image via Wikipedia

I talk about Absorption Rates all of the time…  In fact, in at least 8 posts a month (all of my market report posts) Absorption Rates play a key role.  Understanding what they are and why they matter is a key part of understanding my market reports.

Last year I wrote an in-depth post about exactly what Absorption Rates mean.  I tried to make it a little more real by talking about how it relates to keeping a stock of frozen Pizza around the house.

The concept isn’t terribly difficult to understand, but can sound complicated…  It is one of those things that a lot of people smack themselves in the forehead when they all of a sudden “get it”… and wonder why they didn’t see it all along.

Drop in and take a look…  This is a post that I will reference often…

Enhanced by Zemanta
Copyright © 2009 - 2019 Garage with a Detached Home | Gwinnett County GA. All Rights Reserved. Created by Blog Copyright.