Not Found buyers | Garage with a Detached Home | Gwinnett County GA

LaneBailey.com

Garage with a Detached Home

Contact Lane
  • Custom Listings

    Sign up to get notified when new listingscome on the market that meet your specs.

    Read More
  • What's YOUR Home Worth?

    Get a free Maximum Price Analysis to find out the current market value of your home.

    Read More
  • Browse Listings

    Take a look at what is currently on the market in the areas that interest you.

    Read More
  • 1

Tag Archives: buyers

Norcross, GA, Market Report, September 2011

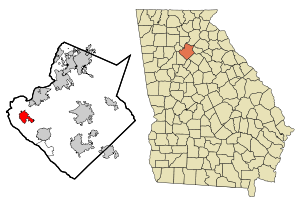
This map shows the incorporated and unincorpor...

Image via Wikipedia

Market stats for Norcross GA, September, 2011 indicate that there were 305 properties on the market. Overall, there is about a 5.6 month supply of properties.  This year has been very strong so far… although April and May weren’t that strong (April was below last year)… it hasn’t slowed much.  September saw 48 sales, well below the 69 for August but slightly above the 43 for last September.  This is one of the few market areas in Gwinnett to post five strong months in a row.

In the sub-$200k arena, there were 174 listings, with about 4.1 month supply. Sales are up from a year ago in this segment, which is the main driver of sales in this area (36 v 25). For the last three months, the AR has been tilted in favor of sellers… it tilted back just a little bit this month. This still looks like one of the strongest price/area segment in Gwinnett County, GA.

Between $200k and $400k, there were 92 listings for sale, and about 9.9 months of supply. This segment isn’t as weak as it had been over the last several months, but it is still weak compared to the rest of the segments in the area, as well as the price level in other areas. The 10 sales were a downer compared to last year’s 14 sales, as well as from last month’s 12 sales. Of course, this segment has always seemed to lag a little.

From $400k to $600k, there were 32 homes on the market. The Absorption Rate is around 11.3 months. The AR had been dropping for months, then shot WAY up in June. It has been working down slowly since. September’s 2 sales are down from 4 the month before and last year’s 4 sales… but with the inventory decrease, it didn’t hurt too much.

In the $600k to $800k arena, there were 5 listings on the market. Inventories had decreased compared to last year. The Absorption Rate is at 15 months of inventory… but with only 4 sales last year and then the sale in March and another each in May and June, obviously it is easy to bump one way or the other. The ONLY reason for the strong looking Absorption Rate last month was that there were so few listings.

The range from $800k to $1m, there was 1 homes listed on the market and no sales… seemingly forever.

Above $1m, there were 3 properties listed. But because of the smaller numbers of sales, the absorption rate could be significantly impacted by just a couple of sales. The single sale in January (first since October) has pushed the Absorption Rate down to 18 months of inventory.

Norcross, GA is a suburb of Atlanta in Gwinnett County. The population is 2000 was 8,410 but that only included the area inside the city limits, and it has seen tremendous growth since that census. The City of Norcross revamped their old town a long time ago, and it has served as a model for other towns in the area. It is also home to Meadow Creek and Norcross High Schools. One of the things that Norcross is known for locally is the beautiful older homes in the downtown area. They have maintained their historic flair quite successfully.

I have a page dedicated to Norcross Market Data.

Atlanta Metro Zillow Home Value Index

Enhanced by Zemanta

Wayback Wednesday… Smooth Sailing After Accepting an Offer?

Sumerian contract: selling of a field and a ho...

Image via Wikipedia

Maybe… maybe not. Last year I had a pretty good post (if I do say so myself) about issues that can arise between Contract and Closing in a real estate transaction.

I wish it weren’t the case… but it is.  There are a lot of reasons that a sale can fall through between the time the seller accepts the offer and the buyer shows up at the closing table.  Some can be easily prevented and others are a little tougher to deal with.  For the most part, though, if both real estate agents do their jobs well and the clients on both side are transparent about any skeletons that might be hiding in the closets, everything should go pretty well.  But even then, there are some issues that can raise their heads at the last minute and derail everyone’s plan.

As listed in the post from last year…

Homes fall out of contract for a variety of reasons.

  • Inspection issues
  • Buyer financial problems
  • Buyer’s remorse
  • Appraisal comes in too low
  • Seller can’t produce title
  • Lender changes standards

And of course there are always strange and unique ways for sales to fail.

It used to be that the most common issue was something popping up in the inspection.  I’ve has buyers jump out of a sale because of an undisclosed issue showing up during inspections… although most of those have been with foreclosed properties (no Seller’s Disclosure statement).  But a couple of times it has been because of a problem that should have been disclosed by the sellers.

Right now, one of the biggest problems is something that was almost unheard of a few years ago… Appraisal coming in low.  I’ve been on both side of this one, and it isn’t fun for anyone.  The buyers begin to second guess their decision, the sellers are over a barrel (especially if the buyer is using FHA financing).  Perhaps the price really was out of market norms and the agents both failed to catch it.  Other times, the property is unique and the Appraiser failed to account for its uniqueness.  In other cases, a sale closes between the Contract and the appraisal that adversely affects the neighborhood’s values.

Of all of them, the one I get most annoyed with is Buyer’s Remorse.  The vast majority of the time, it should be completely preventable.  But sometimes there is a piece of information that comes available during the Buyer’s Due Diligence process.

Buyer financial problems should also be preventable… but sometimes, with (usually) borderline buyers, changing lender standards can jump in and create havoc at the last minute.

Check out the post from last year for more info on how to prevent sales failures between contract and closing.

Enhanced by Zemanta

Buford, GA, Market Report, September 2011

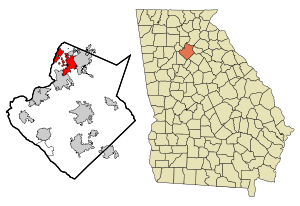
This map shows the incorporated and unincorpor...

Image via Wikipedia

Market stats for Buford, GA, September, 2011 indicate that there were 506 properties on the market. Overall, there was about an 6.6 month supply of properties (Absorption Rate or A/R).  There were 79 sales for August, up slightly from 75 last month and up significantly from 52 from last September (2010).

In the sub-$200k arena, there were 270 listings, with a 4.7 month supply.  This is the largest price segment in this market area, so strength here usually equals strength across the whole local market area.  Sales were down slightly from last month (55 v 56), but impressively strong compared to last year (33 sales in September, 2010).  Framed in the results for the whole market area, the segment is reasonably strong.  And the A/R is well under the 6 months that would be considered fairly balanced… pointing towards a seller’s market.

Between $200k and $400k, there were 175 listings for sale, and about  10.7 months of supply.  The 18 sales recorded were slightly above the 17 from last month and the 17 sales last year for September.  As strong as the Under $200k segment is, this one is MUCH weaker.  It is one of the weaker areas in the county for this price.  Of course, last September, the A/R was just over 17 months.

From $400k to $600k, there were 37 homes on the market. The absorption rate is 1.3 Months.  There has been 9 sales in the last 3 months (6 sales for September, 2 for August, 1 for July).  When the market is rolling, there should be 5-7 sales a month during this part of the year.  This is the first time in a while that we have been there.  This segment had been acting like a luxury segment with sporadic sales for the last few months.  I’d really like to see a follow-up with 4-5 sales for October.

In the $600k to $800k arena, there were 5 listings.  Absorption Rate is 15 months… but it jumps around a lot.  Sales in this range are pretty sporadic, but steady when looking at the long-term.  The drop in inventory over the last few months from 14 homes to 5 homes has made things look less slow… but there have been 5 sales in this segment in the last year… the last was two months ago.

The range from $800k to $1m, there were 11 homes listed. And with only 2 sales in the last year (December, 2010), obviously  trends are hardly definable.  Listings are up, but sales aren’t following, though.

Above $1m, there were 9 properties listed.  The last sale in the segment was in April… of 2009…and then there was May… and 2 sales in June.  FINALLY, new sales!  So, we have 13.5 months of inventory.  I hope, but am not expecting, sales to be more consistent.

Buford, GA is a suburb of Atlanta in Gwinnett and Hall Counties. The population is 2000 was 10,668, but that only included the area inside the city limits, and it had seen tremendous growth since that census.  Buford is home to Lake Lanier, one of Georgia’s premiere recreational areas, and Lake Lanier Islands.  Recently, the City of Buford has revamped their old town. It is also home to Buford (Buford City Schools aren’t a part of Gwinnett County Schools), Mill Creek, Mountain View and Lanier High School (Lanier will open for the 2010-11 school year).

I have a page dedicated to Buford Market Data.

Atlanta Metro Zillow Home Value Index

Enhanced by Zemanta

Sugar Hill, GA, Market Report, September 2011

This map shows the incorporated and unincorpor...

Image via Wikipedia

Market stats for Sugar Hill, GA , September, 2011 indicates that there are 199 homes on the market. Overall, there is about an 5.8 month supply. There were 27 sales, compared to 33 last month and 17 last September. The Absorption Rate (AR) dropped, but that is partly due to a declining listings.

For Sugar Hill homes priced under $200k, there are 145 listings, with about 4.7 months supply. There were 25 sales this September, 2½ times the number from last year for the same time (9). Last month there were 31 sales. Inventories have been fluid, rising and falling. Normally, this time of year we see inventories leveling out.

Sugar Hill Listings between $200k and $400k, there are 45 listings for sale, and about 11.3 months of supply. Last September there was an 11.5 month supply. Last September there were 7 sales, this year there were 2. Last month also had 2. This segment is acting opposite of the under $200k segment, as well as opposite of stronger areas like Suwanee ($200k-$400k).

For listings in the $400k to $600k range, there are 5 homes on the market. The absorption rate is around 15 months, but with 4 sales since last October, it is tough to calculate accurately. Obviously, a sale or two could make a BIG difference. There were only 3 sales in this segment last year. In 2009, there were almost twice as many sales in this price range. I still hope to see some consistent activity in this segment.

In the $600k to $800k, $800k to $1m and Above $1m (combined), the sales are too inconsistent to have a solid read on, but there are only 4 homes listed for sale in that price range. No sales have been recorded in the last 2+ years.

Sugar Hill, GA is a suburb of Atlanta in Gwinnett County. The population is 2000 was 11,399, but that only included the area inside the city limits. The name comes from a bag of Sugar that spilled on a hill while in transit between Cumming and the railroad in Buford. And while it is actually a big market, it is in the shadows of Lawrenceville, Duluth and Suwanee… which all are nearby. That also makes it a great location, as it is close to everything that Gwinnett County, GA has to offer.

I have a page dedicated to Sugar Hill Market Data.

Atlanta Metro Zillow Home Value Index

Enhanced by Zemanta

Wayback Wednesday… Median Home Prices

Three years ago I wrote about a quiet little map that the NAR (National Association of REALTORSS®) had built (and they’re still populating with data) showing the median home prices of various metro areas around the country.  It is pretty interesting to see median prices around the country and compare them with the prices here (or where you live).


View Metropolitan Sales Areas Q1 2011 in a larger map

There is a dark side, though.  That would be looking at the numbers in historical perspective.  Here is a quote from 3 years ago:

For the 2nd Quarter, the Atlanta area was at $158,300, which was down 9.8% from the 1st Quarter.

Now, the Median Home Price here is a little more challenging.  For the 1st Quarter this year the Median Home Price was $99,800, and that was down 9.4% from a year ago.  More importantly, it is down about 37% from three years ago.  I don’t have a complete set of data, but I suspect that the median price has dropped around 50% in Metro Atlanta.

One important note here is that this does NOT mean that the value of any particular house has dropped 50%, or that the average value of homes have dropped 50%.  There is NO mistaking that home prices have crashed and burned… then crashed some more.  But there has also been a shift in the last couple of years towards less expensive homes.

Be sure to keep an eye my local market reports for more specific data about individual areas of Gwinnett County.

Enhanced by Zemanta
Copyright © 2009 - 2019 Garage with a Detached Home | Gwinnett County GA. All Rights Reserved. Created by Blog Copyright.