LaneBailey.com

Garage with a Detached Home

Contact Lane
  • Custom Listings

    Sign up to get notified when new listingscome on the market that meet your specs.

    Read More
  • What's YOUR Home Worth?

    Get a free Maximum Price Analysis to find out the current market value of your home.

    Read More
  • Browse Listings

    Take a look at what is currently on the market in the areas that interest you.

    Read More
  • 1

Tag Archives: market report

Gwinnett County GA Overall Market Report… November, 2010

Gwinnett County Historic Courthouse, Lawrencev...
Image via Wikipedia

Here are the final numbers for Gwinnett County Home sales for November, 2010.

At the end of November, 2010, there were 6,017 homes on the market in Gwinnett County, GA.  As usual, we have a drop off in listings during the Holiday Season.  November listings were down from October.  December also showed a decrease.  While this is a lot of listings, it is low compared to the 10,000+ listings that were on the market a couple of years ago.  There were 488 sales in November.  This was down from 716 sales for November, 2009.  Averaging the result for the last three months yielded an Absorption Rate of 11.2 months of inventory, which has been steadily increasing since June (this isn’t an increase that is good).  This has been pretty consistent across the board on price and location segments, although not exactly the same in all areas.

The Under $200,000 market segment was the meat in this sandwich.  For November, it represented 3,943 homes listed.  There were 231 sales during that period.  So, active listings went up (bad) and sales were WAY down (very bad).  Averaging the last three month gave the segment an Absorption Rate of 11 months.  The rate has been rising since May (rather than the more “market normal” June), having bottomed at just under 7.2 months of inventory.  Year over year sales for October were down from 496 in November, 2009.

In the $200,000 to $400,000 range, there were 1,537 listings county-wide.  The Absorption Rate, currently at about 15.5 months of inventory, has been rising since August.  And while sales are down, listings are down, too.  Year over year sales were down significantly, 69 for 2010 v 171 for 2009.  In effect, while there are less than half of the listings of the next lower market segment, there are barely more than a third of the sales.

Between $400,000 and $600,000, there were 320 listings in Gwinnett County and 8 sales for November, 2010.  Again, the Absorption Rate had been basically dropping since March, 2010, but jumped up significantly based on weak sales in both October and November.  Currently it indicates about 45.7 months of inventory.  Inventories are down slightly, but sales are abysmal v last year.  For November, 2009, there were 34 sales.

In the $600,000 to $800,000 strata, the Absorption Rate indicates 72 months of inventory.  That rate has been rising since July (it was 10 months, then).  But, in February there was a 38 month inventory of properties.  For November, there were 72 listings in this price range.  There was 1 sale… down from 9 in November, 2009.

As we move up to the $800,000 to $1,000,000 price level of Gwinnett County, GA, homes for sale, we see that there were 49 active listings and 2 sales for November, 2010.  This has an indicated Absorption Rate of 82 months of inventory.  Because the sales at this price level are less consistent than at lower levels, the rate bounces around a lot.  But, there is an upward trend in the absorption rate… which isn’t good.

On the top level, Over $1,000,000, there were 96 listings and 1 sale for November, 2010.  Here we have seen the Absorption Rate on the increase, despite the inventory dropping.  For August there was about 36 months of inventory.  Sales are down significantly from last year (when there were 3 sales…).  Since this is a very wide range (prices from $1,000,000 to over $10,000,000), there are more listings and sales than the next level down.  Also, the homes are generally harder to compare because this realm is populated with custom homes and “one-offs”.

I’m looking forward to seeing the sales data for December soon.  It will take quite a while before we get out of comparing to numbers that were skewed by government subsidies and stimulus.

You might have noticed that these reports lag by a month to a month and a half.  The reason for the lag is that it takes until the end of the following month for the data to stabilize.  So, the data for November wasn’t very solid until the beginning of January.  I have tried to use preliminary data, but it always seemed to veer at the last minute…

Enhanced by Zemanta

Lane’s Prognostications for 2011…

Real Estate = Big Money
Image by thinkpanama via Flickr

We’ll see how well I peg this.

Lane’s Predictions for 2011…

Looking back over the last year or two in real estate market reports, there are a few things that have been jumping out at me.

  • For over two years I have been hearing about the millions of homes in “Shadow Inventory”.  These are properties in the foreclosure process, or already foreclosed, that the banks are basically sitting on, waiting until “the market improves” before releasing them into the market.  I predict that next year there will STILL be people talking about the coming giant wave of Shadow Inventory. It isn’t that there isn’t a shadow inventory, but that we have dropped from over 10,000 homes on the market in Gwinnett County, GA to around 6,000.  Even for the overall Atlanta Metro area, we have gone from 120,000 homes to under 70,000.
  • The federal government has been borrowing unheard of amounts of money for the last few years.  Much of it has come from China and other foreign investors… but the deficit spending is not coming to an end, while the depth of the investment pool is…  Despite the best attempts of the Fed, Interest Rates ARE going to rise. Currently we are seeing rates under 5%.  I expect that we will be looking at closer to 7% by the end of the year.
  • Looking at the market reports, there are a few things that are VERY obvious.
    • Government Stimulus for the Housing Market only provides a temporary bump… and then it is worse than it was before, but there will be another wave of government intervention I hope I am wrong on this one).
    • The entry level market (under $200k) is well on the way to recovery… and that will continue. We won’t really know it until around September or October because it will be masked by the tax credits in 2010.
    • Meanwhile, it has been a rough ride for the luxury market.  And I don’t think we will see a meaningful recovery in prices for the Luxury Market (above $600k). There is a lot of downward pressure on this segment, and while there are some signs of strength, the best that segment can hope for is stagnation.
    • The “Near Luxury” segment (from $200k-$600k) will be mixed. It is also the market to watch for signs of permanent recovery.  I know that I will be watching the $200k-$400k and $400k-$600k segments to try to glean the health of the overall market.
  • I fully believe that unemployment (or rather employment) is at the center of the struggle in the Housing Market, and not the other way around.  Until the Unemployment rate drops, housing cannot really recover.  I don’t see Unemployment going under 9% during 2011. In fact, unless something changes radically, I don’t think it will even get that close (maybe 9.3%).

I’ll probably have a few more predictions before long…

Enhanced by Zemanta

Norcross, GA, Market Report, November 2010

This map shows the incorporated and unincorpor...
Image via Wikipedia

Market stats for Norcross, November, 2010 indicate that there were 386 properties on the market. Overall, there is about a 10.3 month supply of properties. October and September sales were down v 2009 (42 v 57 and 43 v 55), but August was way up (52 v 43).  November was a thrashing… 27 v 47 in 2009.

In the sub-$200k arena, there were 215 listings, with about 7.5 month supply.  Sales are down significantly from a year ago in this segment, which is the main driver of sales in this area (25 v 34).  But the segment is still looking pretty strong, despite the weakness in July and September and relative weakness of sales in October and November.

Between $200k and $400k, there were 127 listings for sale, and about 20 months of supply.  Sales have been down and slowing for the last few months.  But October was down (4 v 13 last year).  With the increase in inventory.  November only had 1 sales, v 11 last year.

From $400k to $600k, there were 39 homes on the market. The absorption rate is around 19.5 months. Much of the perception of strong Absorption Rates is from shrinking inventories.  Actual sales have been mostly decelerating.  I expect to see the numbers move the other way in the next few months.

Georgia state route marker. Signs use FHWA typ...
Image via Wikipedia

In the $600k to $800k arena, there were 2 listings on the market.  Inventories have decreased as sales have increased compared to last year.  The absorption rate (6 month average) is at 4 months of inventory… but with only 4 sales this year, obviously it is easy to bump one way or the other. The ONLY reason for the strong looking Absorption Rate is that there are only 2 listings.

The range from $800k to $1m, there were 1 homes listed on the market and no sales… seemingly forever.

Above $1m, there were 2 properties listed.  But because of the smaller numbers of sales, the absorption rate could be significantly impacted by just a couple of sales.  There have been two sales in the last year (Apr 10 and Oct 10).

Norcross, GA is a suburb of Atlanta in Gwinnett County. The population is 2000 was 8,41, but that only included the area inside the city limits, and it has seen tremendous growth since that census. The City of Norcross revamped their old town a long time ago, and it has served as a model for other towns in the area. It is also home to Meadow Creek and Norcross High Schools. One of the things that Norcross is known for locally is the beautiful older homes in the downtown area. They have maintained their historic flair quite successfully.

I have a page dedicated to Norcross Market Data.

Enhanced by Zemanta

Buford, GA, Market Report, November 2010

This map shows the incorporated and unincorpor...
Image via Wikipedia

Market stats for Buford, GA, November, 2010 indicate that there were 584 properties on the market. Overall, there was about an 11.2 month supply of properties.  September was slightly below last year (52 v 60 for 2009).  October was back to the pits (60 v 89 in 2009).  November this year had 44 sales v 67 in 2009.  There were 83 sales in June and an Absorption Rate under 8.5 months.

In the sub-$200k arena, there were 318 listings, with a 9.6 month supply.  October sales were down from 51 in 2009 to 37 this year.  May was the best absorption rate of the year, and it has been going downhill since, but actually got better in October.  It is sliding down again.  Sales for November were 29 this year compared to 40 last year.

Between $200k and $400k, there were 206 listings for sale, and about  11.6 months of supply.  Again, July was the dog, with sales down by 75%.  August, September and October were also down, but the absorption rate improved significantly with July dropping off.  November was off by 35% (13 sales v 20 in 2009).

From $400k to $600k, there were 38 homes on the market. The absorption rate is almost 5 years.  This shouldn’t be acting like a high-end luxury segment, but it is.  There have been 2 sales in the last 3 months.  When the market is rolling, there should be 5-7 sales a month during this part of the year.  There were 5 sales in November, 2009… and 1 this year.

DSCN0559
Image by lane.bailey via Flickr

In the $600k to $800k arena, there were 7 listings.  Sales in this range are pretty sporadic, but steady when looking at the long-term.  The drop in inventory over the last few months from 14 homes to 7 homes has made things look less slow… but there have been 3 sales in this segment since last November… but one was this November.

The range from $800k to $1m, there were 5 homes listed. And with only 1 sale in the last year (Feb 10), obviously  trends are hardly definable.  At least listings are down by more than 50% compared to a few months ago (9 listings in June).

Above $1m, there were 11 properties listed.  The last sale in the segment was in April… of 2009… still…

Buford, GA is a suburb of Atlanta in Gwinnett and Hall Counties. The population is 2000 was 10,668, but that only included the area inside the city limits, and it had seen tremendous growth since that census.  Buford is home to Lake Lanier, one of Georgia’s premiere recreational areas, and Lake Lanier Islands.  Recently, the City of Buford has revamped their old town. It is also home to Buford (Buford City Schools aren’t a part of Gwinnett County Schools), Mill Creek, Mountain View and Lanier High School (Lanier will open for the 2010-11 school year).

I have a page dedicated to Buford Market Data.

Enhanced by Zemanta

Sugar Hill, GA, Market Report, November 2010

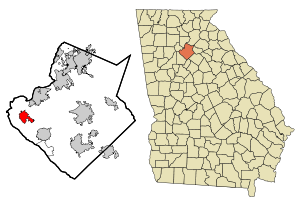
This map shows the incorporated and unincorpor...
Image via Wikipedia

Market stats for Sugar Hill, GA , October, 2010 indicate that there are 239 properties on the market. Overall, there is about an 12.3 month supply of properties.  Sales have been fairly steady since July, but inventories have been rising.

In the sub-$200k arena, there are 160 listings, with under 13.3 months supply.  Sales are also about 65% of the level last year over the last three months.  Sales appear to be decelerating, but perked up for October… still down 10 v 17 compared to last year.

Between $200k and $400k, there are 67 listings for sale, and about 13.4 months of supply.  As recently as May, there was only a 6.75 month supply.  September was better than August, but still pretty weak overall.  October was weaker yet… But November was looking better…

From $400k to $600k, there are 8 homes on the market. The absorption rate is around 24 months, but with 1 sale in the last 6 months, it is tough to calculate accurately.  Obviously, a sale or two could make a BIG difference.  There have only been 3 sales in this segment this year.  Last year there were almost twice as many sales in this price range.

Georgia state route marker. Signs use FHWA typ...
Image via Wikipedia

In the $600k to $800k, $800k to $1m and Above $1m (combined), the sales are too inconsistent to have a solid read on, but there are only 3 homes listed for sale in that price range.  No sales have been recorded in the last 18 months or so.

Sugar Hill, GA is a suburb of Atlanta in Gwinnett County. The population is 2000 was 11,399, but that only included the area inside the city limits.  The name comes from a bag of Sugar that spilled on a hill while in transit between Cumming and the railroad in Buford.  And while it is actually a big market, it is in the shadows of Lawrenceville, Duluth and Suwanee… which all are nearby.  That also makes it a great location, as it is close to everything that Gwinnett County, GA has to offer.

I have a page dedicated to Sugar Hill Market Data.

Enhanced by Zemanta
Copyright © 2009 - 2019 Garage with a Detached Home | Gwinnett County GA. All Rights Reserved. Created by Blog Copyright.