Not Found norcross | Garage with a Detached Home | Gwinnett County GA

LaneBailey.com

Garage with a Detached Home

Contact Lane
  • Browse Listings

    Take a look at what is currently on the market in the areas that interest you.

    Read More
  • What's YOUR Home Worth?

    Get a free Maximum Price Analysis to find out the current market value of your home.

    Read More
  • Custom Listings

    Sign up to get notified when new listingscome on the market that meet your specs.

    Read More
  • 1

Category Archives: norcross

Norcross, GA, Market Report, October 2011

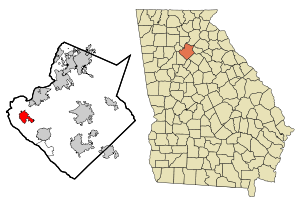
This map shows the incorporated and unincorpor...

Image via Wikipedia

Market stats for Norcross GA, October, 2011 indicate that there were 288 properties on the market.  Overall, there is about a 4.9 month supply of properties.  This year has been very strong so far… although April and May weren’t that strong (April was below last year)… it hasn’t slowed much.  September saw 58 sales, above the 48 for September but well above the 42 for last October.  This is one of the few market areas in Gwinnett to post six strong months in a row.

In the sub-$200k arena, there were 165 listings, with about 3.7 month supply.  Sales are up from both last month and a year ago in this segment, which is the main driver of sales in this area (46 v 36 both in Oct10 & Sept11).  For the last seven months, the AR has been tilted in favor of sellers.  This still looks like one of the strongest price/area segment in Gwinnett County, GA.

Between $200k and $400k, there were 86 listings for sale, and about 8.3 months of supply.  This segment isn’t as weak as it had been over the last several months, and is continuing to build strength.  The 9 sales were solidly up compared to last year’s 4 sales, but down from last month’s 10 sales.  Even though it isn’t gangbusters, it is certainly better than the 28 months of inventory we had in December, 2010.

From $400k to $600k, there were 29 homes on the market. The Absorption Rate is around 9.7 months. The AR had been dropping for months, then shot WAY up in June. It has been working down slowly since. October’s 3 sales are up from 2 the month before and last year’s 1 sale… and the inventory decrease didn’t hurt too much, either.

In the $600k to $800k arena, there were 4 listings on the market. Inventories had decreased compared to last year. The Absorption Rate is at 12 months of inventory… but with only 4 sales last year and then the sale in March and another each in May and June, obviously it is easy to bump one way or the other. The ONLY reason for the strong looking Absorption Rate last month was that there were so few listings.

The range from $800k to $1m, there was 1 homes listed on the market and no sales… seemingly forever.

Above $1m, there were 3 properties listed. But because of the smaller numbers of sales, the absorption rate could be significantly impacted by just a couple of sales. The single sale in January (first since October) has pushed the Absorption Rate down to 18 months of inventory.

Norcross, GA is a suburb of Atlanta in Gwinnett County. The population is 2000 was 8,410 but that only included the area inside the city limits, and it has seen tremendous growth since that census. The City of Norcross revamped their old town a long time ago, and it has served as a model for other towns in the area. It is also home to Meadow Creek and Norcross High Schools. One of the things that Norcross is known for locally is the beautiful older homes in the downtown area. They have maintained their historic flair quite successfully.

I have a page dedicated to Norcross Market Data.

Atlanta Metro Zillow Home Value Index

Enhanced by Zemanta

Wayback Wednesday… Zestimate Accuracy in Atlanta

You just have to love Zillow’s Zestimates.  Log in and look… poof… there is the Zestmate for your home.  Couldn’t be easier.  It’s almost too easy.  OK, it IS too easy.  And while I love the Zestimate just as much as everyone else, I also know that the chances of it being right are pretty slim.

"Lincoln Heights"I don’t want to slam Zestimates, though.  They actually ARE quite useful.  Their usefulness isn’t in their application to individual houses… it has more to do with looking at Zestimates for larger areas… ZIP codes, cities, regions.  The statistical variations that are the problem with looking at individual houses start cancelling each other out.  what we are left with is a pretty good measure of home values for an area.

Last year I posted up a breakdown of the Zestimate accuracy of individual listings in the Atlanta Metro Statistical Area.  The bottom line is that the Zestimate has about a 1 in 5 chance of giving you a value within 5% of the real market value of your house.  And the y are just as likely to be high as they are low.

If you are just curious, it is a fun tool.  If you REALLY need to know, you should talk with an Appraiser or a Real Estate Agent (depending on WHY you really need to know).  And remember, the real estate agent that tells you the highest value is probably wrong… and might even know they are wrong.  In the business, we call it “buying a listing”.  The strategy there is to promise a high listing price, and then come back after you are in a listing agreement and try to get the price down to where it should have been in the first place.  The biggest problem with that strategy is that it completely wastes the prime market time… when the house is first listed.  The end result is that the price usually ends up lower than if you had opted for a slightly lower price to begin with.

Enhanced by Zemanta

Norcross, GA, Market Report, September 2011

This map shows the incorporated and unincorpor...

Image via Wikipedia

Market stats for Norcross GA, September, 2011 indicate that there were 305 properties on the market. Overall, there is about a 5.6 month supply of properties.  This year has been very strong so far… although April and May weren’t that strong (April was below last year)… it hasn’t slowed much.  September saw 48 sales, well below the 69 for August but slightly above the 43 for last September.  This is one of the few market areas in Gwinnett to post five strong months in a row.

In the sub-$200k arena, there were 174 listings, with about 4.1 month supply. Sales are up from a year ago in this segment, which is the main driver of sales in this area (36 v 25). For the last three months, the AR has been tilted in favor of sellers… it tilted back just a little bit this month. This still looks like one of the strongest price/area segment in Gwinnett County, GA.

Between $200k and $400k, there were 92 listings for sale, and about 9.9 months of supply. This segment isn’t as weak as it had been over the last several months, but it is still weak compared to the rest of the segments in the area, as well as the price level in other areas. The 10 sales were a downer compared to last year’s 14 sales, as well as from last month’s 12 sales. Of course, this segment has always seemed to lag a little.

From $400k to $600k, there were 32 homes on the market. The Absorption Rate is around 11.3 months. The AR had been dropping for months, then shot WAY up in June. It has been working down slowly since. September’s 2 sales are down from 4 the month before and last year’s 4 sales… but with the inventory decrease, it didn’t hurt too much.

In the $600k to $800k arena, there were 5 listings on the market. Inventories had decreased compared to last year. The Absorption Rate is at 15 months of inventory… but with only 4 sales last year and then the sale in March and another each in May and June, obviously it is easy to bump one way or the other. The ONLY reason for the strong looking Absorption Rate last month was that there were so few listings.

The range from $800k to $1m, there was 1 homes listed on the market and no sales… seemingly forever.

Above $1m, there were 3 properties listed. But because of the smaller numbers of sales, the absorption rate could be significantly impacted by just a couple of sales. The single sale in January (first since October) has pushed the Absorption Rate down to 18 months of inventory.

Norcross, GA is a suburb of Atlanta in Gwinnett County. The population is 2000 was 8,410 but that only included the area inside the city limits, and it has seen tremendous growth since that census. The City of Norcross revamped their old town a long time ago, and it has served as a model for other towns in the area. It is also home to Meadow Creek and Norcross High Schools. One of the things that Norcross is known for locally is the beautiful older homes in the downtown area. They have maintained their historic flair quite successfully.

I have a page dedicated to Norcross Market Data.

Atlanta Metro Zillow Home Value Index

Enhanced by Zemanta

Wayback Wednesday… Median Home Prices

Three years ago I wrote about a quiet little map that the NAR (National Association of REALTORSS®) had built (and they’re still populating with data) showing the median home prices of various metro areas around the country.  It is pretty interesting to see median prices around the country and compare them with the prices here (or where you live).


View Metropolitan Sales Areas Q1 2011 in a larger map

There is a dark side, though.  That would be looking at the numbers in historical perspective.  Here is a quote from 3 years ago:

For the 2nd Quarter, the Atlanta area was at $158,300, which was down 9.8% from the 1st Quarter.

Now, the Median Home Price here is a little more challenging.  For the 1st Quarter this year the Median Home Price was $99,800, and that was down 9.4% from a year ago.  More importantly, it is down about 37% from three years ago.  I don’t have a complete set of data, but I suspect that the median price has dropped around 50% in Metro Atlanta.

One important note here is that this does NOT mean that the value of any particular house has dropped 50%, or that the average value of homes have dropped 50%.  There is NO mistaking that home prices have crashed and burned… then crashed some more.  But there has also been a shift in the last couple of years towards less expensive homes.

Be sure to keep an eye my local market reports for more specific data about individual areas of Gwinnett County.

Enhanced by Zemanta

Wayback Wednesday… How ’bout Those Housing Starts

Old photo of the estate Hollander Höfe (Höben)...

Image via Wikipedia

Three years ago I published a little article about how housing starts were at their lowest level since 1991…  There were 820,000 starts in September of 2008.  And to me, that was a good thing.  If there is too much inventory, making more inventory isn’t the best idea.

Well… that was three years ago.  In August of 2011 (the last month with available numbers that I could find) there were 571,000 starts.  And furthermore, aside from a couple of bumps, starts have been bouncing along under 600,000 starts since December of 2008.  And I STILL say that it is a good thing.

Inventory is WAY more balanced than it was, even compared to just a year ago.  However, values are still well below where they should be. And there are still the persistent rumors that “the banks” are going to release millions of foreclosed homes that are “in the pipeline”.  Personally, I have been discounting those rumors for a few years… because the same rumors have been around for several years.  For a couple of years now, there have been rumors alluding to “shadow inventory” that was 3-6 months from the market.

So, if inventory is balancing, and starts have been down for years, how could I think that they need to stay low longer?  Well, it comes down to a few factors…

  • Pricing…  It still doesn’t pay for builders to put up houses in many markets.  Basically, pricing almost has to be below the cost of materials plus land in order to get the house sold.
  • Vacant Inventory…  Even in the depths of the crash, I didn’t see as many vacant homes as I do now.  I don’t have stats to back it up, but it seems like vacant inventory is surging.  (BTW, I think that is actually a sign of a recovery forming…)
  • Buyer Fear…  Despite incredibly low interest rates on mortgages and very low prices on homes (even Clark Howard is saying it might be time to move back into real estate), most buyers are still nervous.

Oddly, if you look over my market reports, I specifically refer to a couple of segments as being WELL into Seller’s Market territory.  And it is hard to square these two points…. that there is an active Seller’s Markets (in some segments) AND that starts need to stay low because the market is still weak.  But it comes down to averages…  One city might be rocking the sales, while just up the road everything is stagnant.

Location…


Housing Start Source.

Enhanced by Zemanta
Copyright © 2009 - 2019 Garage with a Detached Home | Gwinnett County GA. All Rights Reserved. Created by Blog Copyright.