Not Found norcross | Garage with a Detached Home | Gwinnett County GA

LaneBailey.com

Garage with a Detached Home

Contact Lane
  • Custom Listings

    Sign up to get notified when new listingscome on the market that meet your specs.

    Read More
  • What's YOUR Home Worth?

    Get a free Maximum Price Analysis to find out the current market value of your home.

    Read More
  • Browse Listings

    Take a look at what is currently on the market in the areas that interest you.

    Read More
  • 1

Category Archives: norcross

How to Read a Market Report…

A lot of real estate agents write them.  Some have a lot of information, others… not so much.  Some are well laid out and go past the numbers into interpretation.  Others have plenty of numbers, but they don’t even give any sort of scale to use for reference.

I try to give mine a sense of scale, as well as interpret what the numbers mean.  I also wait to post them… until the numbers are fairly solid (and even a few weeks later, the numbers might change a little bit…), but not so long as to make the report outdated as it is published.  Below is an excerpt from one of my market reports:

Market stats for Suwanee, GA, August, 2011 indicate that there are 593 properties on the market (down from 612 last month). Overall, there is about an 7.3 month supply of properties (down from 7.4 last month). August had 83 sales. Compared to 2010 (55), that was VERY strong. Inventory was down, as well, compared to 2010 (636).  The last two months have been very strong, but that comes on a very weak June and just average sales for a couple of prior months.  Obviously, I’d like to see continued strength here.

So, let’s break it down.

  • 593 Properties… also showing the number of properties on the market the previous month.  Is it going up or down?  Which way SHOULD it be moving?
  • 7.3 month supply…  This is the Absorption Rate.  Here is a whole post explaining absorption rates, what they are and what they mean.  Balanced, in most real estate segments, is about 6.  Higher is a buyer’s market, lower is a seller’s market.  I also generally show the level of the previous month.
  • 83 sales…  and to put it in perspective, we also want to know how many sales there were last month AND how many for the same month last year.  Sometimes, in slower segments, we might look at the last three months of sales (combined) and compare those with the previous year.  For low volume segments, that will be a number that doesn’t jump all over as much and will give a better idea of market direction and strength.
  • Interpretation & Prediction…  I try to do a little of this for most segments of the market.  I track 7 different postal cities (not the city limits, but the mailing addresses) and each in 6 different price ranges.  That makes for a LOT of predictions and interpretation…  But I try to give what I think of each one… assuming there is enough data to get an idea of what is going on.
  • Something graphical…  My newest tool is a graphical representation (from Zillow) showing a history of the region.  Even more than the pinpoint data of the report, the simple graph gives the aerial view of what is happening.  However, it needs to be kept in perspective…  The beginnings of trend are pretty hard to spot on a long-term graph.

Hopefully this will help you get the most from my market reports…

Atlanta Metro Zillow Home Value Index

Enhanced by Zemanta

Norcross, GA, Market Report, August 2011

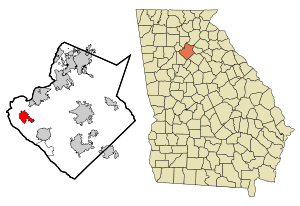
This map shows the incorporated and unincorpor...

Image via Wikipedia

Market stats for Norcross GA, August, 2011 indicate that there were 334 properties on the market.  Overall, there is about a 5.0 month supply of properties.  This year has been very strong so far… although April and May weren’t that strong (April was below last year)… it hasn’t slowed much.  June saw 69 sales, well above the 47 for July and the 52 for last August, and with the decrease in listing inventory the Absorption Rate (AR) built more strength.  This is one of the few market areas in Gwinnett to post five strong months in a row.

In the sub-$200k arena, there were 191 listings, with about 4.0 month supply.  Sales are up markedly from a year ago in this segment, which is the main driver of sales in this area (53 v 39).  For the last three months, the AR has been tilted in favor of sellers… it got a little more so, this month.  This looks like the strongest price/area segment in Gwinnett County, GA.

Between $200k and $400k, there were 104 listings for sale, and about 9.5 months of supply.  This segment isn’t as weak as it had been over the last several months, but it is surprisingly weak compared to the rest of the segments in the area, as well as the price level in other areas.  The 12 sales were a bump from last year’s 9 sales, as well as a good bump from last month’s 6 sales.  Of course, this segment has always seemed to lag.

From $400k to $600k, there were 31 homes on the market.  The Absorption Rate is around 13.3 months.  The AR had been dropping for months, then shot WAY up in June.  It has been working down slowly since.  August’s 4 sales are up from 2 the month before and last year’s 3 sales… but the inventory decrease really helped.

In the $600k to $800k arena, there were 4 listings on the market.  Inventories had decreased compared to last year.  The Absorption Rate is at 12 months of inventory… but with only 4 sales last year and then the sale in March and another each in May and June, obviously it is easy to bump one way or the other.  The ONLY reason for the strong looking Absorption Rate last month was that there were so few listings.

The range from $800k to $1m, there was 1 homes listed on the market and no sales… seemingly forever.

Above $1m, there were 3 properties listed.  But because of the smaller numbers of sales, the absorption rate could be significantly impacted by just a couple of sales.  The single sale in January (first since October) has pushed the Absorption Rate down to 16.5 months of inventory.

Norcross, GA is a suburb of Atlanta in Gwinnett County.  The population is 2000 was 8,410 but that only included the area inside the city limits, and it has seen tremendous growth since that census.  The City of Norcross revamped their old town a long time ago, and it has served as a model for other towns in the area.  It is also home to Meadow Creek and Norcross High Schools.  One of the things that Norcross is known for locally is the beautiful older homes in the downtown area.  They have maintained their historic flair quite successfully.

I have a page dedicated to Norcross Market Data.

Enhanced by Zemanta

Norcross, GA, Market Report, June 2011

DSCN0584

Image by lane.bailey via Flickr

Market stats for Norcross GA, June, 2011 indicate that there were 360 properties on the market (385 for May). Overall, there is about a 5.8 month supply of properties (7.2 months last month). This year has been very strong so far… although it has slowed the last two months… it hasn’t slowed much.  June saw 85 sales, WAY above the 52 for May and the 62 for last June, and with the decrease in listing inventory the Absorption Rate (AR) built more strength.  This is one of the few market areas in Gwinnett to post five strong months in a row.
In the sub-$200k arena, there were 208 listings (225 last month), with about 4.1 month supply (5.4 for May).  Sales are up sharply from a year ago in this segment, which is the main driver of sales in this area (68 v 38).  For the last three months, the AR has been tilted in favor of sellers… it got a little more so, this month.  This looks like the strongest price/area segment in Gwinnett County, GA.

Between $200k and $400k, there were 152 listings for sale (120 in May), and about 18.2 months of supply (last month it was 18.0).  As strong as the under $200k segment is… this one is weak.  The 15 sales were a drop from last year’s 18 sales, but a good bump from last month’s 7 sales.  Of course, this segment has always seemed to lag.

From $400k to $600k, there were 44 homes on the market (34 last month). The absorption rate is around 16.5 months (8.5 in May).  The Absorption Rate has been dropped for 5 months, then shot WAY up this month.  June’s 1 sale is down from 5 the month before and last year’s 4 sales… and the inventory increase didn’t really help.

In the $600k to $800k arena, there were 8 listing on the market (1 last month).  Inventories had decreased as sales have increased compared to last year.  The absorption rate is at 12 months of inventory (1.5 last month, but only 1 listing)… but with only 4 sales last year and then the sale in March and another each in May and June, obviously it is easy to bump one way or the other. The ONLY reason for the strong looking Absorption Rate last month was that there was only 1 listing.  

The range from $800k to $1m, there was 1 homes listed on the market and no sales… seemingly forever.

Above $1m, there were 4 properties listed.  But because of the smaller numbers of sales, the absorption rate could be significantly impacted by just a couple of sales.  The single sale in January (first since October) has pushed the Absorption Rate down to 24 months of inventory.

Norcross, GA is a suburb of Atlanta in Gwinnett County. The population is 2000 was 8,41, but that only included the area inside the city limits, and it has seen tremendous growth since that census. The City of Norcross revamped their old town a long time ago, and it has served as a model for other towns in the area. It is also home to Meadow Creek and Norcross High Schools. One of the things that Norcross is known for locally is the beautiful older homes in the downtown area. They have maintained their historic flair quite successfully.

I have a page dedicated to Norcross Market Data.

Enhanced by Zemanta

Norcross, GA, Market Report, May 2011

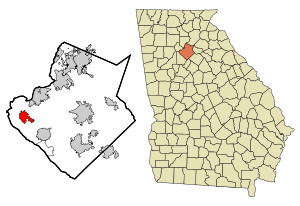
This map shows the incorporated and unincorpor...

Image via Wikipedia

Market stats for Norcross GA, May, 2011 indicate that there were 385 properties on the market. Overall, there is about a 7.2 month supply of properties. This year has been very strong so far… although it has slowed the last two months… it hasn’t slowed much.  May saw 52 sales, slightly above the 49 for April and the 48 for last May, but with the slight decrease in listing inventory the Absorption Rate (AR) still built strength.  This is one of the few market areas in Gwinnett to post four strong months in a row.

In the sub-$200k arena, there were 225 listings, with about 5 month supply.  Sales are up sharply from a year ago in this segment, which is the main driver of sales in this area (39 v 32).  For the last two months, the AR has been in the range of balanced… it got a little better this month.  This looks like the strongest price/area segment in Gwinnett County, GA.

Between $200k and $400k, there were 120 listings for sale, and about 18 months of supply.  As strong as the under $200k segment is… this one is that weak.  The 7 sales were a considerable drop from last year’s 13 sales, but a good bump from last month’s 3 sales.  Of course, this segment has always seemed to lag.

From $400k to $600k, there were 34 homes on the market. The absorption rate is around 8.5 months.  The Absorption Rate has been dropping for 5 months.  This is odd considering the performance of the next segment down, but totally in line with the <$200k segment.  May’s 5 sales are down from 2 the month before, and compares favorable to last year’s 2 sales… and the inventory decrease really helped.

In the $600k to $800k arena, there was 1 listing on the market.  Inventories have decreased as sales have increased compared to last year.  The absorption rate is at 1.5 months of inventory… but with only 4 sales last year and then the sale in March and another in May, obviously it is easy to bump one way or the other. The ONLY reason for the strong looking Absorption Rate is that there is only 1 listing.  Only.  For June there are 8 listings… expect a major change in this segment.

The range from $800k to $1m, there was 1 homes listed on the market and no sales… seemingly forever.

Above $1m, there were 4 properties listed.  But because of the smaller numbers of sales, the absorption rate could be significantly impacted by just a couple of sales.  The single sale in January (first since October) has pushed the Absorption Rate down to 24 months of inventory.

Norcross, GA is a suburb of Atlanta in Gwinnett County. The population is 2000 was 8,41, but that only included the area inside the city limits, and it has seen tremendous growth since that census. The City of Norcross revamped their old town a long time ago, and it has served as a model for other towns in the area. It is also home to Meadow Creek and Norcross High Schools. One of the things that Norcross is known for locally is the beautiful older homes in the downtown area. They have maintained their historic flair quite successfully.

I have a page dedicated to Norcross Market Data.

Enhanced by Zemanta

The Gwinnett County Market is a Little Weird Right Now…

DSCN0561
Image by lane.bailey via Flickr

I have been pulling Gwinnett County Real Estate Market Data, and I’m not done with it yet.  But, I have been seeing a few things.

  • Listings are down markedly from where they would normally be.  This can be either a positive or negative, depending on your outlook.
    • On the Plus Side, fewer listings means that Absorption Rates are better.  There is less inventory to get sold… it tilts the table back toward sellers.  It has been largely tilted toward buyers for quite a while.
    • On the Minus Side, it shows that there is pessimism in the market on the side of sellers.  They aren’t confident about the market.  That lack of confidence has carried over to buyers… sales are also slowing.
  • Sales are down… like I just mentioned.  Even though Absorption Rates make the market look better… the sales just aren’t there.
  • Results are mixed.  There are a few cities that are doing well… and there are a few price segments that are doing quite well.  Others are VERY weak.
Enhanced by Zemanta
Copyright © 2009 - 2019 Garage with a Detached Home | Gwinnett County GA. All Rights Reserved. Created by Blog Copyright.