Not Found sellers | Garage with a Detached Home | Gwinnett County GA

LaneBailey.com

Garage with a Detached Home

Contact Lane
  • What's YOUR Home Worth?

    Get a free Maximum Price Analysis to find out the current market value of your home.

    Read More
  • Custom Listings

    Sign up to get notified when new listingscome on the market that meet your specs.

    Read More
  • Browse Listings

    Take a look at what is currently on the market in the areas that interest you.

    Read More
  • 1

Category Archives: sellers

Buford, GA, Market Report, April 2012

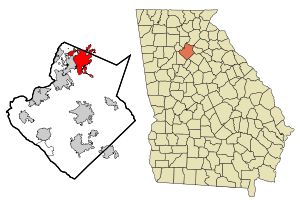
This map shows the incorporated and unincorpor...

Image via Wikipedia

Market stats for Buford, GA, April, 2012 indicate that there were 399 properties on the market.  Overall, there was about an 5.1 month supply of properties (Absorption Rate or A/R).  There were 86 sales for April, flat from 86 last month and up from the 73 sales last April (2011).  It isn’t the strongest market in Gwinnett, but it is much better than it has been.

In the sub-$200k arena, there were 227 listings, with a 4.2 month supply.  This is the largest price segment in this market area, so strength here usually equals strength across the whole local market area.  Sales were flat from last month 61, but up compared to last year (51 sales in April, 2011).  But, the A/R is under the 6 months that would be considered fairly balanced… pointing towards a solid seller’s market.

Between $200k and $400k, there were 126 listings for sale, and about 6.2 months of supply.  The 19 sales recorded were flat from the 19 from last month and down a bit from the 22 sales last year for April.  This had been one of the weaker segments in the county, but has improved dramatically and at current A/Rs, it is one of the stronger $200k-$400k segments in the county, again, with increasing strength.

From $400k to $600k, there were 24 homes on the market.  The absorption rate is 8.0 Months.  There have been 9 sales in the last 3 months (0 for February, 3 for March and 6 for April).  When the market is rolling, there should be 6-8 sales a month during this part of the year.  September was pretty strong, and but we didn’t have the follow-up the next two months I was looking for… December was back in the right direction, and the drop in listings certainly helps.  January certainly wasn’t the month to call a recovery, nor February.  March showed a little promise.  April was nice.  Just for comparison, there was 1 sale in the Feb.-Apr. period in 2011.

In the $600k to $800k arena, there were 6 listings. Absorption Rate is 4.5 months… but it jumps around a lot.  Sales in this range are pretty sporadic, but steady when looking at the long-term. The drop in inventory over the last few months from 14 homes to 6 has made things look less slow… but there were 4 sales in this segment last year… and 3 sales in March.  This is a sign of strength, but the low inventory is what is driving the incredible A/R.

The range from $800k to $1m, there were 7 homes listed.  But, with no sales last year (2011), obviously trends are hardly definable. Listings are down, but sales aren’t following through.

Above $1m, there were 9 properties listed.  The last sale in the segment was in April… of 2009…and then there was May, 2011… and 2 sales in June, 2011.  So, we have 36 months of inventory.  I hope, but am not expecting, sales to be more consistent.

Buford, GA is a suburb of Atlanta in Gwinnett and Hall Counties. The population is 2000 was 10,668, but that only included the area inside the city limits, and it had seen tremendous growth since that census. Buford is home to Lake Lanier, one of Georgia’s premiere recreational areas, and Lake Lanier Islands. Recently, the City of Buford has revamped their old town. It is also home to Buford (Buford City Schools aren’t a part of Gwinnett County Schools), Mill Creek, Mountain View and Lanier High School (Lanier will open for the 2010-11 school year).

I have a page dedicated to Buford Market Data.

Atlanta Metro Zillow Home Value Index

Enhanced by Zemanta

But the News Said…

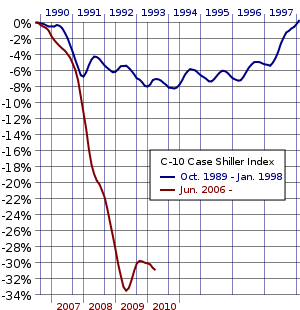
English: Change of the Case-Shiller Home Price...

English: Change of the Case-Shiller Home Price Index relative to its peak values in 1989 and 2006. Series starting in 1989 is in blue. Series starting in 2006 is in red. (Photo credit: Wikipedia)

One of the comments I hear the most is “but the news said…”.  There are always stories on the news about the NAR (National Association of REALTORS®) market stats, Case-Shiller or others.  Most of the statistics are based on national numbers.  Case Shiller is a little more local, in that it is based on the local area… if you can call the Atlanta region “local”.

One thing I would note is that the Atlanta region DOES tend to track pretty close to national averages.  But being pretty close isn’t the same as being the same.  And even if it were, there is a huge difference between the Atlanta Metro area and Gwinnett County… much less Suwanee, or the Morningview subdivision.

And that is the problem…

We can’t listen to the news and have a clear picture of what it means for our house or our neighborhood.  It would be the same as looking at the Dow Jones Industrial Average (DJIA) and deciding whether a specific stock was going to go up or down.

But that is exactly what people do… They see a report on the network news and then decide that houses are over-priced, under-priced or whatever.  When the real fact is that some market segments are rocking bargains right now… there is too much inventory and not enough buyers.  Other segments have scarce inventory and homes are selling as fast as they are listed (if they are priced appropriately).  But the national news… or even the local news… can’t be that exact in their reporting.

Unlike a lot of real estate professionals, I don’t begrudge the news for reporting the “big picture” story on the real estate market.  We DO need to know what is happening on a national basis.  But we also need to remember that there are vast differences between neighborhoods, price ranges, ZIP codes, school areas, etc.

The best bet is to talk with a local agent… I have monthly market reports on 7 cities in Gwinnett County, GA.  If this is your area, you can get a much better idea of what is going on around you.  If you really want to know what is happening, let me know and we’ll talk about YOUR house.

Enhanced by Zemanta

Sugar Hill, GA, Market Report, April 2012

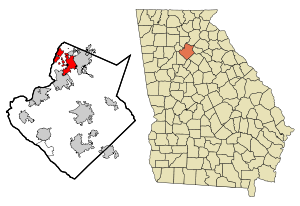
This map shows the incorporated and unincorpor...

Image via Wikipedia

Market stats for Sugar Hill, GA , April, 2012 indicates that there are 152 homes on the market.  Overall, there is about an 5.6 month supply.  There were 32 sales, compared to 23 last month and 20 last April.

For Sugar Hill homes priced under $200k, there are 110 listings, with about 4.9 months supply.  There were 25 sales this April, significantly better than last year for the same time (17).  There were 25 sales last month.  Inventories have been fluid, rising and falling.  Normally, this time of year we see inventories leveling out, but this month there was only a slight increase.  There should have had a major inventory bump over the last two months.

Sugar Hill Listings between $200k and $400k, there are 37 listings for sale, and about 12.3 months of supply.  Last April there was an 15.5 month supply.  There were 3 sales, this year there were 7.  Last month only had 1 sale.  It makes last month look more like a fluke.

For listings in the $400k to $600k range, there were 3 homes on the market.  The absorption rate was around 6 months, but with 3 sales in November (and those being the only sales since July), it is tough to calculate accurately.  Obviously, a sale or two could make a BIG difference.  I still hope to see some consistent activity in this segment.

In the $600k to $800k, $800k to $1m and Above $1m (combined), the sales are too inconsistent to have a solid read on, but there were only 2 homes listed for sale in that price range. No sales have been recorded in the last 2+ years.

Sugar Hill, GA is a suburb of Atlanta in Gwinnett County. The population is 2000 was 11,399, but that only included the area inside the city limits. The name comes from a bag of Sugar that spilled on a hill while in transit between Cumming and the railroad in Buford. And while it is actually a big market, it is in the shadows of Lawrenceville, Duluth and Suwanee… which all are nearby. That also makes it a great location, as it is close to everything that Gwinnett County, GA has to offer.

I have a page dedicated to Sugar Hill Market Data.

Atlanta Metro Zillow Home Value Index

Enhanced by Zemanta

Lilburn, GA Market Report, April 2012

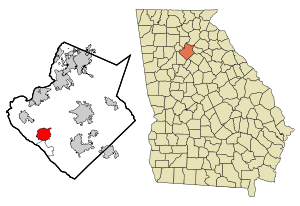
This map shows the incorporated and unincorpor...
This map shows the incorporated and unincorporated areas in Gwinnett County, Georgia, highlighting Lilburn in red. It was created with a custom script with US Census Bureau data and modified with Inkscape. (Photo credit: Wikipedia)

Market stats for Lilburn, GA, April, 2012, indicate that there were 327properties on the market (as of April 30th). Overall, there was about an 6.2 month supply of properties and 65 properties that closed (sold) in April. It was a huge increase from last year’s sales (44) and an increase from March (51 sales). The Absorption Rate notched down a good bit. Lilburn had been among the weakest of Gwinnett County, GA, cities I track. But, at 6.17 months of inventory, it isn’t nearly as bad as it had been just a year ago (14.35 months of inventory in Feb, 2011, for example).

In the sub-$200k arena, there were 229 listings, with about an 5.4 month supply with 51 sales. This represents most of the sales in the market area. Sales increased solidly from last month (41), and were also up from last year (32). While the Absorption Rate isn’t as low as many other areas, sales are strong, and I’m still pulling for a comeback for Lilburn. The track is getting a little better.

Between $200k and $400k, there are 85 listings for sale, and about 8.5 months of supply. This segment had been quite weak for months, and had stalled a little, but came back with a vengeance. It is stalling a bit again. There were 14 sales compared to 11 last year. This segment really needs to get back into single digit A/Rs … but, Lilburn has never been seen as a luxury market. But the decrease in listings has really helped. I’m still not as confident about this portion of the Lilburn market coming back quite yet… It was strengthening, just not as consistently as I’d like.

From $400k to $600k, there are just 9 homes on the market. The absorption rate is 27 months (one year average). There was 1 sales in March. It was the first sale in the segment since last July. Poised for a comeback, but the increase in listings and weak sales don’t give the right ingredients for that to happen.

From $600k to $800k, $800k to $1M and Above $1M, there are 4 listings (combined), but too few sales to have any sort of reliable number of months of inventory. March posted the first sale since August, 2010. It was in the $600-$800k range. One of the listings is above $1M and one between $800k and $1M, and there is no market activity in the last 12 months for those ranges…

Lilburn is in Gwinnett County, GA, just outside of Atlanta. As of the 2000 Census, there were 11,307 people in Lilburn, but that is only including people in the city limits, and there has been a lot of growth since 2000 in Gwinnett County. It was incorporated in 1910. Lilburn is home to Parkview High School, and also has students that the Brookwood, Berkmar and Meadowcreek clusters. It is also home to Killian Hill Christian School, Providence Chrisian Academy, St. John Neumann Catholic School and Parkview Christian School. Possibly the most famous resident of Lilburn is General Beauregard Lee, a groundhog with a better winter prediction record that Puxatawnee Phil up in PA. Dominique Wilkins, formerly of the Atlanta Hawks also lives in Lilburn.

Atlanta Metro Zillow Home Value Index

I have a page dedicated to Lilburn Market Data.

Enhanced by Zemanta

The “Best” Deal?

Buyers and sellers in the Plazuela de los Sapo...

Buyers and sellers in the Plazuela de los Sapos, Puebla, Mexico (Photo credit: Wikipedia)

It might be one of the most asked questions I get from both Buyers and Sellers…

Is this the “best” deal?

The problem is that there is almost never an answer.  It isn’t as simple as a mathematical equation… unless there are variables to include for things like emotion, comfort and other intangibles.  The other problem is that just trying to figure out if THIS is the best deal can change the answer to the equation.

People have a tendency to “dig in” when they are pressed.  Buyers or Sellers hit a limit to what they want to do, and often they hit that limit harder when  the other party is trying to test the limits.

We’ve all heard the story of the boiling frog…  If you put him in a pot of boiling water, he jumps out, but if you put him in comfortable water and slowly heat it, he will sit there and boil.

boiling water עברית: מים רותים

boiling water עברית: מים רותים (Photo credit: Wikipedia)

It works the same with buyers and sellers.  If a Buyer sends an offer with a very low price (we’ll leave aside value v pricehere…) to start negotiations, the Seller often digs in and won’t accept an offer that they might have accepted had negotiations started from a more acceptable point.  Conversely, if a Seller starts with a list price that is too high, the Buyers may just not submit an offer… or they might pick the property apart and submit a lower offer than they might have otherwise.

Of course the thing to remember is that it certainly ISN’T the best deal if it never happens…

Enhanced by Zemanta
Copyright © 2009 - 2019 Garage with a Detached Home | Gwinnett County GA. All Rights Reserved. Created by Blog Copyright.