I’m making a big change for the market reports from January, 2013, forward.

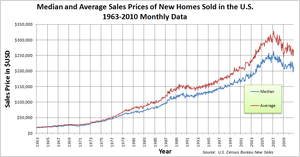
English: Chart showing the median and average sales prices of new homes sold in the United States by month/year. Based off of US Census Median and Average Sales Price of New Houses Sold Data. Please note that the sales price includes land. Also, the average from 1963-1974 inclusively, is annual, and not monthly. (Photo credit: Wikipedia)
Instead of tracking average Days on Market (DoM), I’m going to track median DoM. It might not seem like much of a change, but I’m seeing segments where the average is 100+ days, while the median 50 or 60 days. The reason for this is that the average is giving too much weight to a few outlier properties that might have 500 or more days on the market.
A while back, FMLS, the primary provider of the data I analyze, changed the way THEY calculated DoM. The started tracking the property for total days on market instead of just the most recent listing.
While FMLS’s policy change made the data more accurate for individual listings, it also made it much less relevant for the market trends. The median data is more accurate for market trends because it lowers the effects of the outliers.
I discontinued posting the DoM data in the market reports a while back because it ceased being useful, but I have continued to track it. Moving forward, while I still probably won’t include the DoM data directly in the reports, I will allude to it as I see trends develop.
Enjoy…

