Not Found Lane Bailey | Garage with a Detached Home | Gwinnett County GA

LaneBailey.com

Garage with a Detached Home

Contact Lane
  • Custom Listings

    Sign up to get notified when new listingscome on the market that meet your specs.

    Read More
  • What's YOUR Home Worth?

    Get a free Maximum Price Analysis to find out the current market value of your home.

    Read More
  • Browse Listings

    Take a look at what is currently on the market in the areas that interest you.

    Read More
  • 1

Author Archives: Lane Bailey

Garbage In… Garbage Out…

Garbage Only

Garbage Only (Photo credit: Peter Kaminski)

It is an axiom among data types… Garbage in = garbage out.  you can’t derive good data from bad.  If you put garbage into the system, you are destined to get garbage back out.

MLS (Multiple Listing Service) data is the same way.  Real Estate Agents have to use strange and unique search patterns to overcome the bad data put in by other real estate agents… in some cases because the inputting agents are lazy, in others because they are incompetent… or a combination.  Mix in some “over-confidence” because they “have been doing this forever and don’t you dare think you can tell them what’s what” for good measure.

In this case, I’m talking about school district data.

Some of Butte's School Buildings (1915)

Some of Butte’s School Buildings (1915) (Photo credit: Butte-Silver Bow Public Library)

One of the main motivators people have in looking at a certain area will revolve around picking the best schools they can find.  In fact, the last areas to go down in value and the first to begin to rise are those with solid schools.  And the areas with solid schools had less of a slide to begin with.

Getting the schools right is a BASIC part of our jobs.

Unfortunately, we can’t rely on the seller (home owner) to know which schools serve their area.  Unless they currently have children in all of the schools, their data may be out of date.  Sometimes, even when they DO have kids in school.

In the case of one local area, there was a re-districting that went into effect in June, 2010.  A new High School, Middle School and Elementary School were added in the area.  But, we are almost 3 years into this change.

You’d think that agents would have a handle on it…

Wheelwright's tools

Wheelwright’s tools (Photo credit: Wikipedia)

Well, you’d be wrong.  In fact, you’d be wrong 30% of the time.  Yep, out of 210 listings in this High School cluster, 64 of them had bad school data.  Usually one wrong school out of three… sometimes two.  I didn’t look to see if they were in the wrong cluster totally…  The one area that really surprised me was that 2 of them were new construction.

One of the tools that EVERY agent needs to use is the online data from school systems.  Granted, some school systems are a decade behind the times on getting districting maps online, but that is NOT the case here in Gwinnett.

But often, agent think they know the schools (since they have been an agent in this area since it was farmland) or the look to see what other agents have put in for the neighborhood… or worse yet, they look at the schools listed by Trulia (which can even be in the wrong county).  So, they don’t spend 10 minutes checking online.

I expected that with the agents listing bank-owned properties over the last few years.  They were churning their listings, not caring about serving the needs of buyers.  But as we have moved back into an era of private sellers again, I’m a little surprised at how few agents have the right info…

And Where Does This Go?

WRONG WAY

WRONG WAY (Photo credit: CarbonNYC)

First… as a seller, how many buyer searches are you missing out on because your agent doesn’t have basic information like schools entered properly?  Buyer search by school…  And they BUY based on schools they search.

Second… if they aren’t paying attention to things like schools, what other details are they not noticing?  I run across poor descriptions, bad pictures and other faulty data all of the time.

Third…  how much actual money or time are YOU wasting, as a seller, while buyers skip past your home because the data isn’t correct?  The average days on market for homes listed in this cluster over the last year with the RIGHT info is 86.  The average for homes listed with the WRONG data is 108.  Do YOU want to spend an extra 22 days on the market… almost an extra full house payment?

Fourth… and this is the one I don’t have the ability to find data for… how many times were homes put under contract, only to fall out of contract when the buyers discovered that they weren’t in the school system they thought?  How much missed market time was there?

Want to know more? Give Lane a call…


Enhanced by Zemanta

Lawrenceville, GA Market Report, March 2013

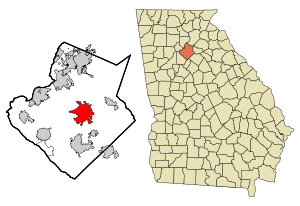
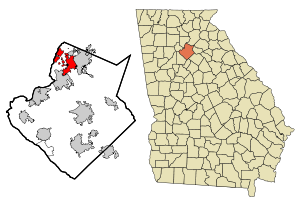
This map shows the incorporated and unincorpor...

Image via Wikipedia

Market stats for Lawrenceville, GA, March, 2013, indicate that there were 606 properties on the market, down 27 from last month. Overall, there was about a 3.3 month supply of properties. In 2012, sales for March were at 275, so 217 sales was a big decrease, year over year. Last month’s sales were at 170. But, coupled with the decrease in inventory, things are still looking pretty good. Normally the market picks up from January-February through about June-August. This month we are OK, but some are arguing that constrained inventories are still holding back sales or we could be looking even better. In almost every market I follow in Gwinnett, there was an increase in listings… except here.

For Lawrenceville, GA, Homes Under $200k, there are 467 listings, with about a 2.9 month supply of homes. Sales were down from March, 2012 (174 v 260), although sales may very well be off because of constrained inventories. Last year in this segment, there were almost 900 listings v under 500 now. This segment is easily the lion’s share of sales for the area. With the 2.99 month A/R, it is solidly in Seller’s Market territory. The low Absorption Rate (AR) is due to very strong sales, coupled with dramatically lower listing inventories. Month over month sales were up from 154 last month. Again, there was a big drop in listed properties for this month.

Between $200k and $400k, there are 126 listings for sale, and about 5.4 months of supply. Oddly, this had one of the mid-pack segments in the county, now it’s on the weak side. The 42 sales for March, 2013 trounced the 14 from last year, and killed the weak 16 sales last month. We had been close but slipped back into Seller’s Market territory here… again.  Last month we were in a Buyer’s Market.

From $400k to $600k, there are 9 homes on the market. The absorption rate is around 13.5 months. However, with the level of sales in this segment, a couple of sales added or subtracted can have a HUGE impact. There was 1 sale for March, the Absorption Rate has dropped from 78 months June11, through good, but sporadic sales. This is acting like a luxury market and the A/R is jumping all over the place… with just a few sales (A/R was 34 10 months ago and 4.5 three months ago). While the long term trend was looking a little better, now it is still pretty choppy.

In the $600k to $800k arena, there are 2 listings, with about 8 months of supply. As with the next lower priced segment, a couple of sales makes a big difference and there were 0 sales in March. There were only 6 sales at this level in all of 2011. There were 4 sales in 2012.

Between $800k and $1M, and Above $1M there are 2 homes listed (combined) and not enough sales data to give an accurate absorption rate. Until this month, there had only been one sale in this range in the last 3 years (Aug, 2010), according to FMLS. But, there was 1 sale in July 12. It was over $1M, if that makes a difference…


Lawrenceville is in Gwinnett County, GA, just outside of Atlanta. As of the 2000 Census, there were 22,937 people in Lawrenceville, but that is only including people in the city limits, and there has been a lot of growth since 2000 in Gwinnett County (2008 estimates from the Census Bureau peg population around 29,000). It was incorporated in 1821. Lawrenceville is home to Central Gwinnett High School, and also has students that the Mountain View and Archer clusters. It is also home to Gwinnett Technical College and Georgia Gwinnett College. Another recent addition to Lawrenceville is that it is home to the Gwinnett Braves, playing at the Gwinnett Stadium on GA20 between I-85 and GA316. Possibly the most famous resident of Lawrenceville was Oliver Hardy. As a small boy he lived in Lawrenceville with his parents for a short time. Lawrenceville was also home to Junior Samples. Some of its other residents included Jeff Francouer, Brian McCann and Jennifer Ferrin.


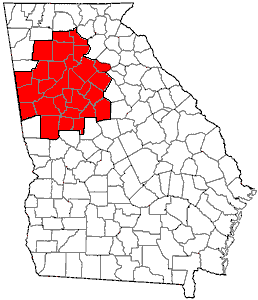
Atlanta Metro Zillow Home Value Index

I have a page dedicated to Lawrenceville Market Data.

Enhanced by Zemanta

Buford, GA, Market Report, March 2013

This map shows the incorporated and unincorpor...Market stats for Buford, GA, March, 2013 indicate that there were 281 properties on the market, an decrease of 26 from last month. Overall, there was about an 4.5 month supply of properties (Absorption Rate or A/R). There were 67 sales for March, up from 63 last month but down from the 86 sales last Mar12. It isn’t the strongest market in Gwinnett, but the A/R is nothing to sneeze at. It is still in Seller’s Market territory.

In the sub-$200k arena, there were 119 listings, with a 3.3 month supply. This is the largest price segment in this market area, so strength here usually equals strength across the whole local market area. Sales were up from last month 42 (v 34 last month), and well down compared to last year (61 sales in Mar12). But, the A/R is well under the 6 months that would be considered fairly balanced… pointing towards a solid seller’s market. This time of year we should start seeing an increase is sales… and listings.

Between $200k and $400k, there were 117 listings for sale, and about 5.0 months of supply. The 23 sales recorded were down from the 26 last month and up from the 19 sales last year for March. This had been one of the weaker segments in the county, but had improved dramatically until last month it was fairly balanced, though tilted towards buyers… now it is slightly further into Seller’s Market territory.

From $400k to $600k, there were 32 homes on the market. The absorption rate is 13.7 Months. There have been 7 sales in the last 3 months (5 for January, 2 for February and 0 for March). When the market is rolling, there should be 5-7 sales a month during this part of the year. Just for comparison, there were 4 sales in the Jan-Mar period in 2012. This segment has been bouncing all over the place…

In the $600k to $800k arena, there were 4 listings. Absorption Rate is (again) 12 months… but it jumps around a lot. Sales in this range are pretty sporadic, but steady when looking at the long-term. The drop in inventory over the last few months from 14 homes to 4 has made things look less slow… but there were 3 sales in March last year and 1 in March this year.

The range from $800k to $1m, there was 1 homes listed. Trends are hardly definable. Listings are down. June recorded the first sales since December, 2010. There was 0 sales in March. So it now has a 3.0 month Absorption Rate.

Above $1m, there were 8 properties listed. There was sale in the segment in April… of 2009…and then May, 2011… and 2 sales in June, 2011… also 1 in July and September, 2012. There was 1 sale in March. So, we have 24 months of inventory. I hope, but am not expecting, sales to be more consistent.

Buford, GA is a suburb of Atlanta in Gwinnett and Hall Counties. The population is 2000 was 10,668, but that only included the area inside the city limits, and it had seen tremendous growth since that census. Buford is home to Lake Lanier, one of Georgia’s premiere recreational areas, and Lake Lanier Islands. Recently, the City of Buford has revamped their old town. It is also home to Buford (Buford City Schools aren’t a part of Gwinnett County Schools), Mill Creek, Mountain View and Lanier High School (Lanier will open for the 2010-11 school year).

I have a page dedicated to Buford Market Data.

Atlanta Metro Zillow Home Value Index

Enhanced by Zemanta

Atlanta Home Prices up 40% From Last Year?

According to the AJC, Metro Atlanta home prices shot up an amazing 40% between March, 2012 and March, 2013.  This is looking at the median prices for “metro Atlanta”.  Unfortunately, they don’t give us a breakdown…

But, I am going to tell you that the news isn’t quite that rosy.  And here’s why:

Licensing

Licensing (Photo credit: Wikipedia)

This looks at the median value of properties that closed during each time period (March, 2012 and March, 2013).  It doesn’t look at neighborhoods, zip codes or cities.  This becomes a problem with what I call “market creep”.

Last year, we were seeing a LOT of investor sales.  Many of these were foreclosed properties, being unloaded by banks, at firesale prices.  Not only that, but they were VERY often at the extreme low end of the market.  These are houses that in a strong market might sell for under $60k or $70k.  Granted, their prices were SUPER cheap… sometimes as low as $25k or $30k.  But, they were insufficient numbers as to push down the overall market.

*** A quick note about “median” and “average”***  Many people use one or the other, sometimes as if they were interchangeable, but they are quite different.

Average is derived by adding everything up and dividing it by how many there were to add up.  So, if you had $1, $2, $10, $37 and $100, it would add up to $150.  Divide that by 5, and the average would by $30

Median is derived by looking at the middle value.  With our numbers above, half are above $10, half below.  The median would be $10.

This year, we are seeing more expensive homes going on the market.  Also, they are less frequently foreclosures or short sales.  So, the “normal” listing prices are higher.  In effect, houses could be selling for similar prices, but the mix could have changed.

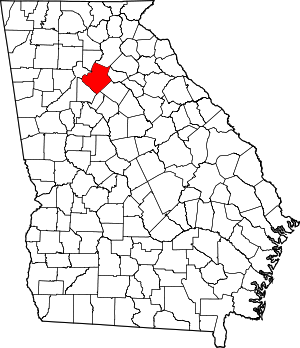
Map of Georgia highlighting Gwinnett County

Map of Georgia highlighting Gwinnett County (Photo credit: Wikipedia)

Going back to our previous numbers…

This time we had sales of $25, $26, $30, $34 and $35.  Our average sale is still $30, but our median sale has now also jumped up to $30

The sales aren’t really comparable to the previous group, but, it appears that there has been a HUGE increase in the median value.  In real estate, these exact numbers aren’t realistic, but the concept is still true.

Here in Gwinnett, we have seen a solid 10% appreciation over the last year.  There are pockets where it could be argued higher, and others where it is lower, but 10% is a defensible increase.

In order to REALLY get to the bottom of it, we have to look at subdivisions, and maybe even sections of a subdivision (in the case of the larger ones).  Even then, we need to make adjustments for condition and even intangible changes (distressed v non-distressed sales).

The bottom line is that there are VERY few home owners that have seen their properties appreciate even close to 40% in the last year.  But there is a reasonable chance that they have seen 10% appreciation.

Going after statistics with a shotgun, like this article did, seeks to erase the differences with a large volume of properties.  The problem is that it is misleading to most consumers… buyers AND sellers.  About the only thing it does is make some sellers feel better about their homes… but it doesn’t really do that honestly.

If YOU want to find out about YOUR Gwinnett home’s value, give me a shout.

AJC link

Enhanced by Zemanta

Sugar Hill, GA, Market Report, March 2013

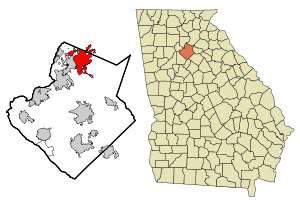
This map shows the incorporated and unincorpor...

Image via Wikipedia

Market stats for Sugar Hill, GA , March, 2013 indicates that there were 110 homes on the market. down 1 from last month. Overall, there is about an 4.5 month supply (4.8 last month). There were 33 sales, compared to 25 last month and 26 last March. Of course, then there were 153 listings on the market.

For Sugar Hill homes priced under $200k, there were 63 listings, with about 3.6 months supply. There were 24 sales this March, a little below last year for the same time (25). There were 16 sales last month. Inventories have been fluid, rising and falling. This time of year we often see a slight increase in listings… but we are very low. In fact, sales may be stifled by lack of inventory. Christmas slowed things down, as usual, but it’s time to pick up again.

Sugar Hill Listings between $200k and $400k, there are 43 listings for sale, and about 6.8 months of supply. Last March there was a 30 month supply. There was 1 sale then, this year there were 9. Last month had 8 sales. That makes two of the last three months look pretty strong. We are almost in a Balanced Market here.

For listings in the $400k to $600k range, there were 4 homes on the market. The absorption rate was around 6.0 months, but with 0 sales this month, it is tough to calculate accurately. Obviously, a sale or two could make a BIG difference. I’ve finally started to see some consistency here. Hopefully we’ll have a little more action during the rest of the Spring selling season.

In the $600k to $800k, $800k to $1m and Above $1m (combined), the sales are too inconsistent to have a solid read on, but there were 0 homes listed for sale in these price ranges. No sales have been recorded in the last 2+ years.

Sugar Hill, GA is a suburb of Atlanta in Gwinnett County. The population is 2000 was 11,399, but that only included the area inside the city limits. The name comes from a bag of Sugar that spilled on a hill while in transit between Cumming and the railroad in Buford. And while it is actually a big market, it is in the shadows of Lawrenceville, Duluth and Suwanee… which all are nearby. That also makes it a great location, as it is close to everything that Gwinnett County, GA has to offer.

I have a page dedicated to Sugar Hill Market Data.

Atlanta Metro Zillow Home Value Index

Enhanced by Zemanta
Copyright © 2009 - 2019 Garage with a Detached Home | Gwinnett County GA. All Rights Reserved. Created by Blog Copyright.